Boyd Group Services Inc. (TSX: BYD), Business as Usual
Published on 2026-04-18
Boyd Group Services Inc. is a Winnipeg based owner of North American autobody repair shops. In previous decades, the company has successfully employed a roll-up style acquisitive growth strategy in a stable and high synergy market. In the shadow of the company’s largest acquisition in history, shares have fallen significantly, a move which we do not see as warranted given the context of the environment surrounding the business. As a result, we believe a very attractive buying opportunity exists for BYD shares at present.
In 1990, Boyd Autobody & Glass opened its first location in Winnipeg, Manitoba, quickly growing their presence in the area by opening an additional 11 shops by 1995. In 1997, the firm listed on the TSX under the ticker BYD, trading as an income trust and providing investors with consistent and considerable dividends. Around the turn of the century, the corporation began to utilize cash flows in an alternative way, namely in the pursuit of purchasing other autobody and collision service shops in an accretive fashion. BYD quickly became a staple of the TSX, posting remarkable returns for the following two decades on the back of good-dealmaking and store management.
At present, BYD owns over 1,300 collision service shops across North America, with major brands including Gerber Collision & Glass, Joe Hudson’s Collision Center, Assured Automotive, and Boyd Autobody & Glass. Figure 1 shows BYD’s store presence in North America (excluding Gerber locations in Hawai’i).
Figure 1: Geographic Footprint
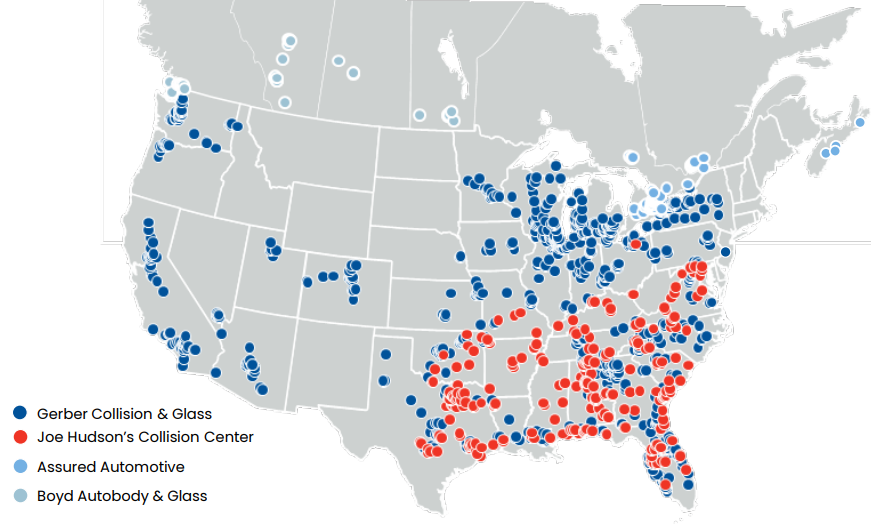
Source: Company Presentation
Acquisitive Growth Engine
Nearly the entirety of BYD’s corporate success is attributable to its successful acquisitive growth strategy. Synergies come in a variety of forms, all of which allow a shop or small multi shop operator (MSO) to realize significant cost savings under the wing of BYD, as well as certain revenue synergies.
Procurement Processes
BYD has significantly higher buying power in input markets for paint, parts, and repair equipment. Lower input costs immediately translate to higher margins, meaning that a shop under the BYD corporate entity is significantly more valuable for this reason alone. Additionally, BYD employs standardized sets of repair equipment across locations to decrease maintenance capex.
Calibration Services
BYD is also able to realize significant synergies in relation to calibration services; the precise process of aligning vehicle sensors for parking and advanced driver assistance systems (ADAS). Relevant equipment for these services requires an upfront investment of $100-300k, and potential liabilities in the case of a botched repair job could be high enough to put a single shop out of business in relation to an automatic braking system, lane keep assist system, or blind spot detection failure. Because of this, small shops and MSO’s often do not offer full calibration services. Under the BYD banner, an investment in calibration equipment is relatively small, and potential liabilities from mistakes are manageable on a corporate level. This allows BYD to acquire shops who do not offer calibration services, make a small investment in equipment, and subsequently capture revenue that was previously directed elsewhere at a high margin (calibration services are inherently high margin compared to frame repairs, etc.)
Fixed Cost Dilution and General Corporate Synergies
When onboarding a smaller chain of shops or single entities, BYD is able to place all locations on a centralized operating platform for HR, IT, accounting, and other back office functions like billing and insurance claims handling, creating significant cost savings. Additionally, employed technicians can be more effectively utilized via centralized planning.
Location Density
By acquiring locations adjacent to those which BYD currently owns, the firm is able to create an interconnected web of shops and exploit a number of relevant synergies. Higher location density translates to a shorter tow-truck drive distance for any collision occurrence site, as well as shorter inter-shop routing in the case that a damaged vehicle need be moved from one location to another. Higher location density also means lower costs of rental vehicles, a feature which insurance companies have a strong preference for and can generate revenue synergies.
Insurer Relationships
Nearly the entirety of BYD’s revenues stem from the insurance companies which cover individual’s vehicles in North America. Although individuals who have car accidents have the legal say to choose where their vehicle is repaired, insurance companies have a strong preference for large operators and exercise their power in directing repair traffic to them. Insurers will streamline claims, provide faster approvals, and handle a larger portion of admin for a given claim when it is done via a direct repair program (DRP) with an operator like BYD. Customer incentives are strong for DRP, and thus the majority of individuals will choose this when vehicle work is needed. For the insurers, a plethora of cost savings exist when working with a larger repair operator, like communication efficiencies, rental car cost savings (previously mentioned), and a lower cost of repair (BYD shops offer the lowest cost to serve in the industry due to their corporate scale). As a result, BYD sees a significant revenue synergy in purchasing small shops and MSO’s, as they become a part of a chain receiving preferential treatment from insurers.
Technician Training
In the shifting post-COVID labour market, finding and economically employing repair technicians has been somewhat of a pressure point for BYD and its peers. In response to these issues, BYD has employed an internal pipeline of technician training, creating the conditions for more consistent post-training performance, and better employee retention via relationship building and a larger career ladder length. Compared to a small shop or MSO, this represents a lower average cost of labour, a synergy which can easily be realized in the case of acquisition.
As a ‘serial acquirer’, BYD has successfully realized these synergies hundreds of times for multiple decades. In a roll-up situation, there is a significant ‘learning by doing’ effect, and BYD has had significant experience in both learning and doing.
Bearish Sentiments
From looking at an all time share performance chart and corroborating with our above description of Boyd’s business, it is clear that the company has built a very solid model for success. In spite of this, BYD shares are down nearly 25% year-to-date and almost 50% over the last two years, representing only the second time BYD shares have drawn down over 50% in company history (2022 was first case, result of supply chain issues). Figure 2 shows BYD’s share price performance over the past 20 years.
Figure 2: Historical Share Performance
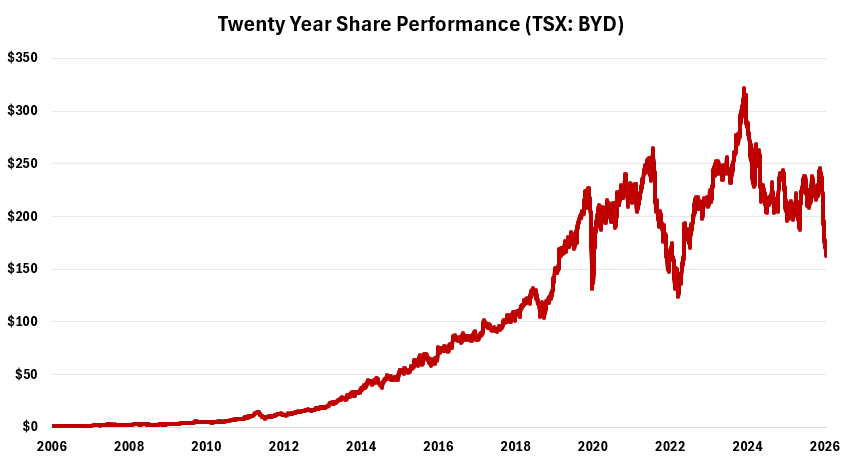
Source: S&P Capital IQ, Phi Research
So how can we explain this recent underperformance of shares? There are a number of contributing factors which we will review below, starting with investor suspicions around the number of quality acquisition targets remaining in the market.
Acquisition Target Stagnation
One of the claims we have seen in negative commentary surrounding BYD is that there is a growing stagnation in the number of acquisition targets available for the firm. A lack of acquisition targets means a stagnation of Boyd’s acquisitive growth engine, and what you are left with is a quality business, but not a growing one.
In reality, these sentiments are not credible. Despite having helped consolidate the industry for almost thirty years, the autobody and collision repair shop space is still highly fragmented. In North America, there are approximately 30,000 collision repair shops producing roughly $50 billion in annual revenues. Over 70% of this revenue can be accounted for by operators with less than 5% market share, and ~23,200 of the 30,000 shops in North America are standalone entities. Additionally, there are 770 MSO operators in the United States alone who account for ~2,300 shops, nearly double BYD’s footprint of ~1,300 shops. Figure 3 shows a snapshot of the collision repair service shops market.
Figure 3: Collision Service Repair Shop Market Breakdown
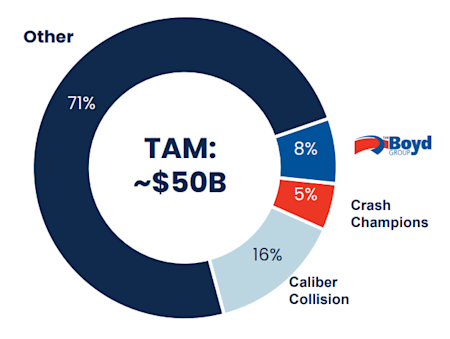
Source: Company Presentation
Clearly there is a lot of room for acquisitive growth remaining. In the context of BYD’s ~1,300 locations, ~23,200 single store locations and ~2,300 MSO owned locations are massive opportunities for growth.
We think that, in part, some of this negative sentiment may stem from BYD’s acquisition of Joe Hudson’s Collision Center in late 2025. This was the largest deal in BYD company history, representing over 250 acquired locations (nearly a 25% growth in BYD locations in a single deal), and coming with a large debt and equity financing to pay the ~$1 billion purchase price. The Joe Hudson’s deal will not be subject to as many synergies as smaller tuck-ins due to the maturity and larger nature of the chain, and this could potentially signal to uninformed investors that overall deal quality is declining. Ultimately, if we assume that BYD is able to execute on realizing deal synergies at or even below their presented expectations, it was a tremendous purchase. Although the exploitable synergies may be lower on a per shop basis, they are still very high, their scale is much larger as compared to tuck-in deals, and in a good dealmaking process the purchase price is reflective of differences in post purchase synergies regardless.
Ultimately, we don’t see any credibility to claims that acquisition target options are decreasing.
Same-Store-Sales Growth Concerns
For any company that makes a living on acquisitive growth, understanding same-store-sales patterns is integral to understanding the fundamentals of the business. In general, there are no structural drivers increasing revenue on an industry wide scale for the collision repair and autobody sector. The industry is mature: there are no unserved markets to exploit, no markets where the number of drivers is changing significantly, and no organic growth out of line with inflation on an aggregate basis. In spite of this, Boyd’s same store sales growth levels have outpaced inflation in recent decades, largely attributable to the aforementioned revenue synergies which BYD realizes on purchased entities. Figure 4 shows Boyd’s same-store-sales growth levels on a quarterly basis over the previous two decades.
Figure 4: Same-Store-Sales Growth
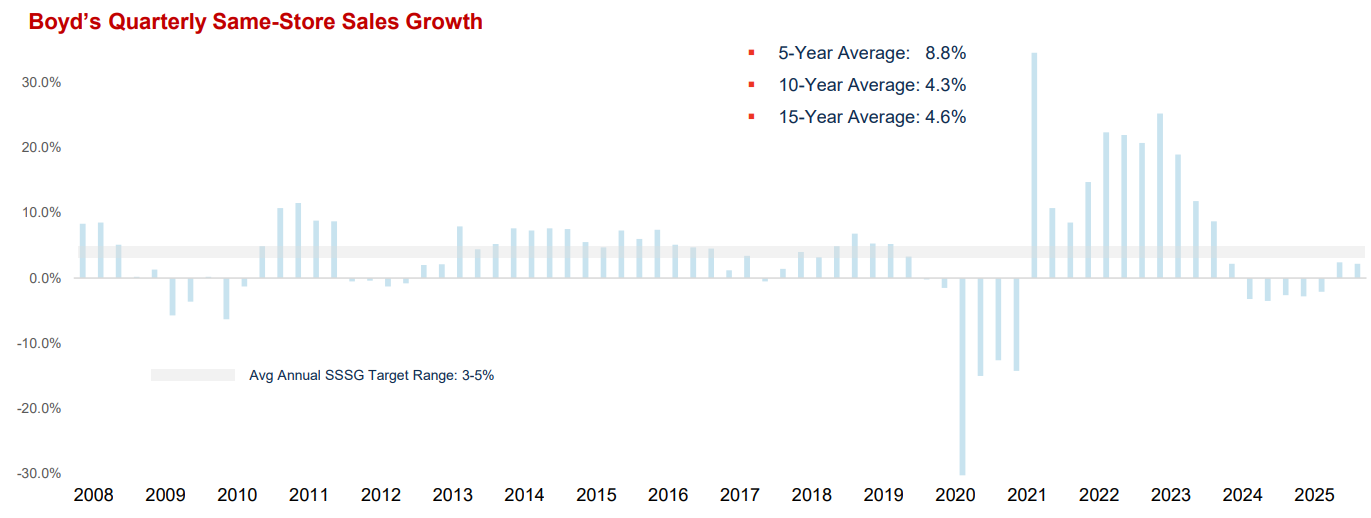
Source: Company Presentation
Under normal conditions, Boyd will generally realize SSSG of 3-5% per annum. From late 2023 into 2025, Boyd struggled to produce SSSG above zero for a number of reasons.
The first was a weakness in used vehicle prices. Post pandemic, new auto supply was extremely low due to weak forecasted supply and supply chain issues like the 2021 and 2022 chip shortage. As supply for new vehicles recovered in 2023 and 2024, used vehicle prices fell significantly. Figure 5 shows the percentage change in the Manheim Used Vehicle Value Index from 2022 to present.
Figure 5: Changes in Used Vehicle Value
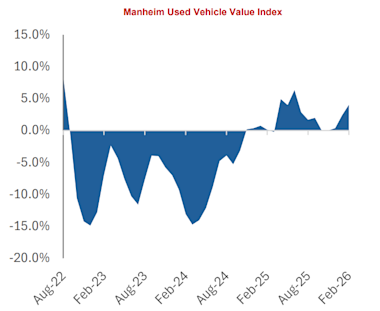
Source: Company Presentation
Used vehicle prices have an impact on Boyd’s business as they are the determinant of whether or not a given insurance claim is a write-off or not. Any vehicle in a collision is benchmarked to used vehicles in the market by insurers. Thus, higher used vehicle prices mean more collisions result in repairs, and lower used vehicle prices mean more damaged vehicles are simply written off.
The second cause of unimpressive SSSG in recent years was mild winter conditions, especially in the winter of 2023-2024. Mild winter conditions mean less collisions and subsequent lower volumes to Boyd shops.
Ultimately neither of these drivers of weak growth are structural; they are within the normal course of business and simply short-term trends. Used vehicle prices have recently began to increase again, and although there will be constant fluctuations, there is no reason to believe that prices are at risk of moving out of line with broad scale inflation levels in the long-term. In Q3/2025 and Q4/2025, BYD returned to posting positive SSSG, with growth of ~1% and ~2% respectively. Full year 2025 SSSG was -0.2% in spite of this, garnering a large negative reaction from the market upon Boyd’s Q4/2025 release.
One thing which we seldom see discussed in relation to Boyd and which could play a role in changes to SSSG is the potential impacts of automated driving processes. ADAS systems like automatic braking, lane keeping, and blind spot monitoring are all becoming somewhat standard features in new vehicles. Studies typically find that ADAS systems are able to cut collisions by roughly 25%. Although this is an impressive number, it is difficult for partially automated systems to address the main causes of collisions; human distraction, risky decision making at intersections, extreme weather, and high-speed multi-factor collisions. Additionally, studies are largely done in closed form environments and do not account for the potential for human overreliance on partially automated systems (potential for offsetting lackadaisical behaviour).
About one-third of North American vehicles already have these systems installed, meaning that the impact of ADAS on Boyd is already very real. If a third of potential vehicles have seen a 25% decrease in collision occurrence, holding vehicle count constant, it is somewhat puzzling that BYD has not lost ~8% of same-store revenues in recent years. In reality, the impacts of ADAS are much more nuanced, namely in regards to its impact on calibration requirements. As previously discussed, calibration is Boyd’s highest margin source of revenue and is rapidly growing due to the influx of ADAS systems and their service requirements. Additionally, the cost of repairing vehicles with ADAS that have been in a collision is higher, as vehicle complexity is increased greatly relative to older vehicles.
Altogether, current ADAS trends are not particularly alarming for Boyd given the incremental per claim revenue which has come with the implementation of ADAS systems on vehicles. Although collisions per vehicle are likely to continue declining as the share of vehicles with ADAS grows from ~33% to 100%, this will be offset by the cost of servicing the systems. As per Boyd management, the impact of ADAS will likely have a -2% impact on SSSG in the industry in the medium-term, offset by a ~1% increase from calibration needs and a ~1% increase from vehicle complexity and average claim size. When considering this and the revenue synergies which BYD can consistently deliver on via acquisitions, management and sell-side analyst’s estimates of 3-5% SSSG going forward seem very reasonable.
As far as considering fully automated driving systems, it is harder to distinguish with certainty what their impact may be. Currently employed fully automated driving systems offer much more significant collision savings as compared to ADAS, however it is worth noting that these vehicles have only been tested in low-speed, good weather conditions with perfectly mapped road systems. As compared to a modern vehicle with ADAS, fully automated vehicles once again require more complicated repair processes in the instance of damage and thus more repair revenues for BYD. Additionally, the impact of fully automated vehicles on the number of vehicles on the road could be tremendous, especially when considering situations like commercial trucking, package delivery, and food services like DoorDash.
Only about 5% of North American vehicles are replaced on a yearly basis, and given the lack of commercial availability of autonomous vehicles, consumer concerns surrounding the products, regulatory hurdles, and technological limitations surrounding the employment of autonomous driving in low density areas, the timeline for a world where a significant fraction of vehicles drive themselves is many decades long. The timeline for a world where all vehicles drive themselves is even further. Given this fact and the large offsetting effects of autonomous vehicle collision prevention and their impacts on aggregate vehicle driving miles and average insurance claim size, we don’t really believe that fully autonomous vehicles are a relevant consideration for BYD at the moment. Of course, this is an important storyline for the company in the long-term, but we would consider it an akin risk to BYD as solar power is to oil & gas.
Altogether, we don’t see SSSG deviating meaningfully from inflation in the near future or medium term. Although there are unique factors which impact revenues in the short-term like weather and vehicle supply dynamics, these factors are short lived and have small impacts. The impact of ADAS has not proven to have a material negative impact on BYD thus far, and given the number of vehicles on the road which have implemented these systems to date, we don’t see a material change coming in the future either.
Although sell-side analyst’s estimates are not perfect, Boyd is a well covered name given its dual-listing and decades long prevalence in the market. On a SSSG basis, analysts have a very positive outlook for BYD in the near-term, with estimates calling for 3.27% SSSG in 2026 and 4.02% in 2027. Estimates have largely trended in the positive direction in the past years, marking another good sign for performance.
Figure 6: Same-Store-Sales Growth Estimates
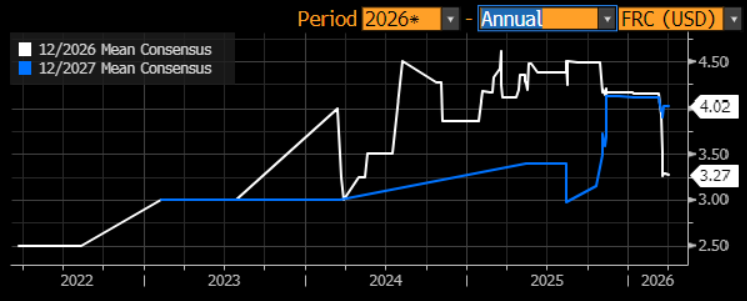
Source: Bloomberg
Profitability Pressures
As a business exhibiting low organic growth and stable demand, Boyd’s profitability metrics tend to fall under a high degree of scrutiny. As of late, BYD’s ‘margin story’ has garnered some bearish sentiment, especially given earnings per share underperformance. Although many investors, especially those who invest in businesses like Boyd, value earnings per share, we do not view it as a relevant metric from an investment perspective given its non-cash nature. Boyd has generated free cash flow at strong levels in recent years and is forecast by analysts to continue doing so in the future. On an EBITDA margin basis, BYD’s performance has been relatively stable recently, with small quarterly swings occurring based on weather and other short-term factors. Figure 7 shows Boyd’s EBITDA margins and earnings per share levels over the past 15 years.
Figure 7: Profitability Metrics
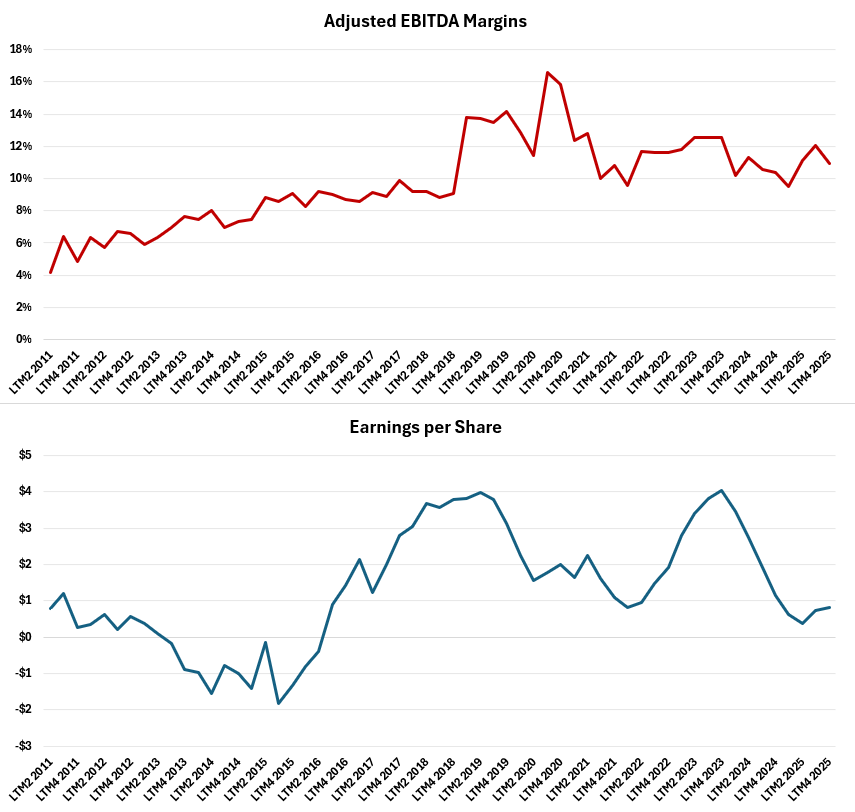
Source: S&P Capital IQ, Phi Research
As per Figure 7, clearly nothing catastrophic has occurred as of late from an EBITDA margin perspective. Margins are strong given the industry profile and have consistently held in the range of ~12% post-COVID.
The situation most pertinent to BYD’s profitability (and most frequently discussed) is the shortage of repair technician labour. Although this is by no means a burgeoning situation (has been an issue for over a decade), its impacts on the market were accelerated by the pandemic. Post-COVID, a large number of an aging population of technicians never returned to work, all in conjunction with the halting of technician training. The result was somewhat of an inflection point for technician labour requirements, which had a small downward impact on Boyd’s profitability. Years later, the situation has not worsened, and there is not a structural reason to believe that it would. In spite of that, it is a frequently discussed and overemphasized part of Boyd’s investment story.
In 2017 Boyd began to address potential technician labour shortages by shifting its technician training to be done internally. Post-COVID, an extreme emphasis was put on these programs to moderate potential labour cost inflation, an initiative which has largely been effective. Although the labour shortage in the technician space is legitimate, it is not growing, and although time lags are present, individuals always transfer from and enter new careers in a space that is ‘overpaying’ on a relative basis. Given wage inflation has been higher for technicians than it has been in other spaces, the movement of individuals to the career path has already begun to occur and is somewhat of an inevitability. Additionally, Boyd is able to pass on a share of labour costs to insurance companies, although once again this is not immediate or frictionless.
In short, we do not see anything concerning surrounding Boyd’s profitability as of late, and do not see any signals of factors which may change the story.
Leverage and Amplification via Joe Hudson’s Acquisition
In conjunction with the Joe Hudson’s acquisition, Boyd took on a significant amount of leverage (~$500 million) and issued nearly $900 million in equity. Many investors in securities like Boyd have a preference for lower leverage, something which we see as unwarranted so long as lending is secured at the right rate. When we consider all the previously discussed scrutiny of Boyd, although we have established it as unwarranted, negative sentiment is in many ways amplified by a large acquisition being made. Debt loads are high at present, bearish investors would like a cash return rather than reinvestment, and instead Boyd has gone “all in” with a large investment of capital. Although we are confident in Boyd’s ability to secure synergies given their track record, investors who are not in agreement with us have an extra justification to sell shares at present given debt loads and execution risks. Ultimately leverage is not a legitimate issue with Boyd and we believe that the Joe Hudson’s acquisition was a quality investment, meaning any short term selling from those who raise issue is simply a good opportunity for purchase in our eyes.
In a ten minute chat, it would be very easy to bring up the above bearish arguments in conjunction, discuss at a high level, and leave believing that the conditions surrounding Boyd’s business are weakening. When assessing these sentiments in detail, we don’t grant a great deal of credibility to any of them. None of the trends surrounding the business at present are outside of what we would assign to be the usual course of business. Despite this, share valuations have diverged from normal levels meaningfully.
Corporate Governance and Management Alignment with Shareholders
Before going into greater detail on share valuation, we will discuss Boyd’s corporate governance. As is always the case, assessing an entity’s corporate governance is essential for establishing confidence in the execution of financial targets in both the short-term and long-term. Only when management and board members are exceptionally qualified and properly motivated by compensation can we have faith in their business at present and in the future.
Board of Directors
Boyd has an adequately sized board of directors with nine members, with eight of nine members being independent. The board boasts strong backgrounds in investment (David Brown, Managing Director of RBM Capital Limited and previous CEO of Richardson Capital Limited), acquisitive growth (Robert Espey, previous CEO of Parkland Corporation during their acquisitive growth phase), automotive experience (Brian Kaner, current CEO of Boyd Group, previous CEO of Icahn Automotive and President of Sears Automotive), and a plethora of other corporate experience (Violet Konkle, previous CEO of The Brick Ltd.). All board members are mandated to own a significant portion of shares, and director pay is largely delivered in equity.
Executive Compensation
BYD is headed by President and CEO Brian Kaner. Kaner joined Boyd in 2022 as Chief Operating Office before being appointed as President and CEO in August of 2024 (note that the previous CEO, Timothy O’Day, has not sold stock since his succession). Prior to joining Boyd, Kaner served as CEO of Icahn Automotive and as President of Sears Automotive. Over three quarters of Kaner’s compensation is ‘at-risk’, with a similar split being granted to other relevant executives. Figure 8 shows CEO compensation mix.
Figure 8: Chief Executive Officer Compensation
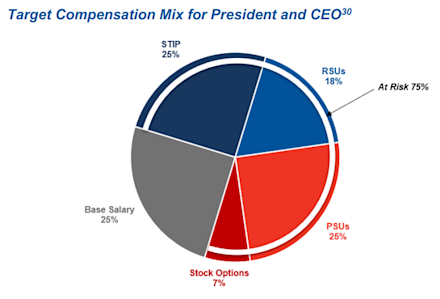
Source: Company Filings
Short-term incentives payments are based off of the realization of revenue growth targets, EBITDA margins levels, and new shop counts. For long-term rewards, compensation is determined based on the achievement of ROIC targets and the performance of BYD shares relative to peers. We like this scheme as a balance of incentivizing growth, capital discipline, and cost efficiencies, by far the three most important things to incentivize with respect to Boyd’s business.
Valuation
On an EV/EBITDA basis, BYD shares trade at their lowest level over the past ten years by far. Figure 9 shows Boyd’s forward and trailing EV/EBITDA multiples over the past decade.
Figure 9: Relative Valuation
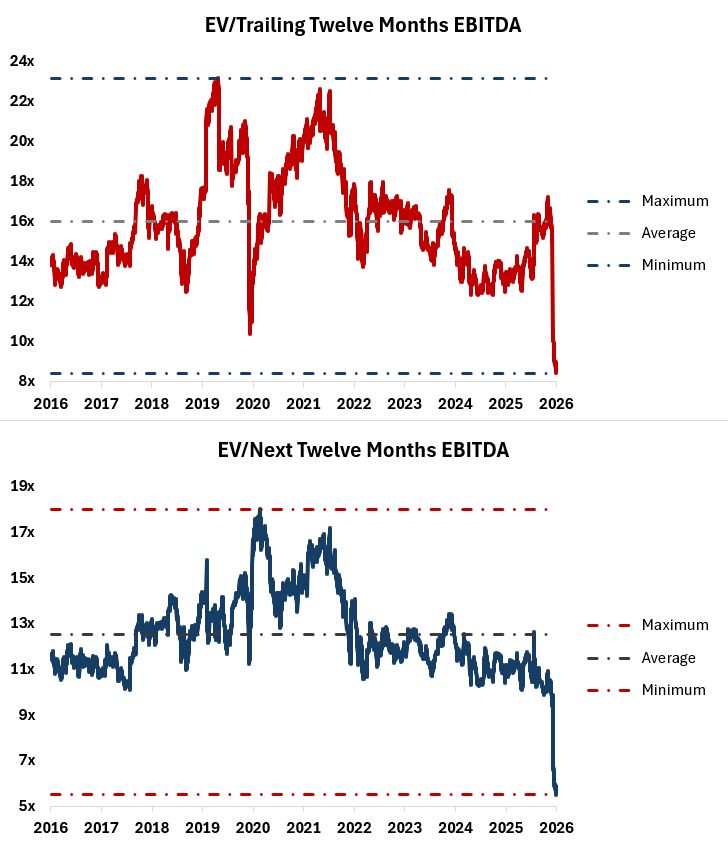
Source: Bloomberg, Phi Research
Boyd currently trades at ~8.4x trailing EBITDA as compared to a 10-year average of roughly 16.0x, and at ~5.5x EBITDA on a forward basis as compared to a 10-year average of ~12.5x. On a forward basis, BYD is as cheap as a number of Canadian oilfield service companies in spite of operating in a stable market, having lower competitive pressures, far lower capital requirements, and a long runway for acquisitive growth. On a relative basis, shares are extremely attractively valued.
What we have found from modelling future financial performance is that the same holds true on a cash flows basis. Since BYD is dual listed (NYSE: BGSI) and reports their financials in USD, we have decided to forecast the company’s financial performance in USD from top to bottom. This allows for a simpler and more easily interpretable model.
We model BYD’s roll-up strategy by finding free cash flow in a standard manner, and then subtract dividend payments and interest payments to find ‘acquisition capital’, or the amount of free cash flow available for acquisitions. We then use the Joe Hudson’s acquisition as a framework for future acquisitions to be made: entities are purchased at roughly 10x EBITDA, a 9% EBITDA margin, and can then have cost synergies exploited to reach 14% over a three year period. This is a somewhat conservative manner of estimating acquisitive growth, as the Joe Hudson’s deal is subject to fewer synergies than many smaller acquisitions which will likely be made. In spite of analyst’s estimates expecting otherwise and the revenue synergies which BYD can generally exploit, we assume that SSSG will be 0 for the entire forecasted period in the name of being conservative, and to reflect an overly bearish perspective of the impacts of ADAS. Depreciation, working capital accounts, lease payments, and maintenance capital expenditures are all estimated as a percentage of revenue, as all of these balances scale directly with the growth of acquired revenue. To determine firm value, we then take the present value of dividend payments over the next five years, as well as an exit value which is determined using an EV/TTM EBITDA multiple of 12.5x (well below 10-year average of ~16x, see Figure 9 for context). Figure 10 shows our full discounted cash flows model for BYD.
Figure 10: Discounted Cash Flows Model
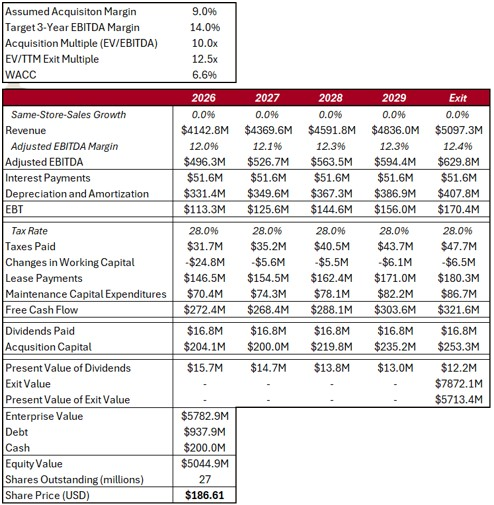
Source: Phi Research
Given our assumptions, we come to an implied share price of $186.61 USD (~$255.63 CAD), roughly 52% higher than Friday’s close of $122.75 USD ($167.85 CAD). The nature of our model is not such that it is particularly sensitive to changes in inputs, largely due to the stable and low financing costs nature of BYD.
It is worth noting that BYD management has put goals in place via ‘Project 360’ to reach EBITDA levels of $700M by 2029 while also achieving margins of ~14%. Our model assumes that these goals are not met and that margins do not grow significantly from this point.
It is also worth noting that our model purports financial results far below analyst’s estimates on a revenue, EBITDA, and free cash flow basis for the observed period. Figure 11 below shows analyst’s consensus values for BYD.
Figure 11: Analyst’s Consensus Estimates
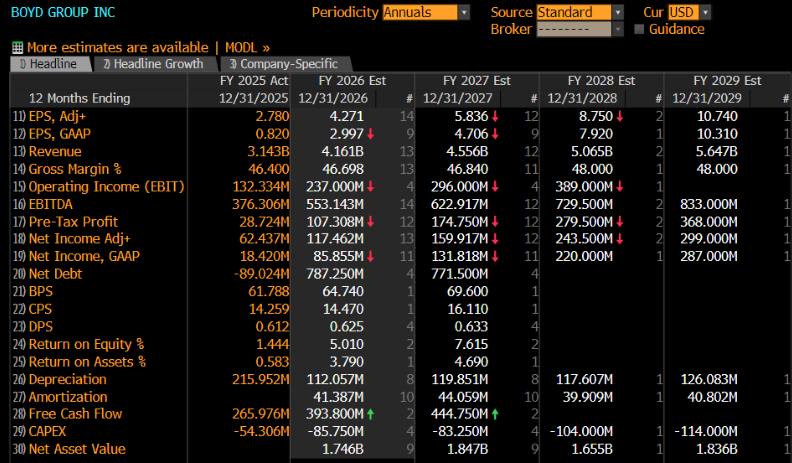
Source: Bloomberg
When we look at Boyd’s Project 360 goals and analyst’s consensus numbers, what our model is assuming is essentially a total failure on the part of the BYD management team. Financial results miss short-term and long-term goals significantly, margins do not materially improve from current levels, and acquisition targets are assumed to be low-synergy on a relative basis. Additionally, sentiment surrounding the business remains muted at exit, and same-store-sales growth is completely stagnant. Even in this failure of a situation, BYD is worth almost 50% more than investors can buy it for in the market at present.
In conjunction with our comprehensive model, we have also constructed a two-year multiple valuation model (Figure 12). This model takes analyst’s consensus EBITDA estimates, applies an EV/TTM EBITDA multiple at exit, and then discounts this to the present for an implied current enterprise value (plus the value of dividends received in the interim).
Figure 12: Multiple Valuation Model
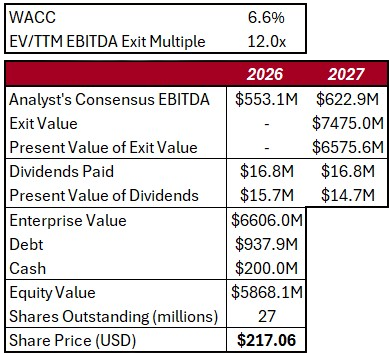
Source: Phi Research, Bloomberg
Our multiple valuation model grants us an implied share price of $217.06 USD (~$297.34 CAD) when using a 12.0x EV/TTM EBITDA exit multiple and our calculated 6.6% WACC. This is ~77% above Friday’s close of $122.75 USD ($167.85 CAD).
Given that analyst’s estimates are imperfect and that future trading multiples are not certain, we conduct a sensitivity analysis on our results (Figure 13). 2027 EBITDA surprise represents the variance in realized EBITDA as compared to analyst’s current estimates. For an exit multiple, we use 8x as a low end (in-line with current levels, historical low) and 20x as a high end (around the 75th percentile of 10-year trading values). For more context on BYD’s historical trading multiples, see Figure 9.
Figure 13: Multiple Valuation Sensitivity Analysis
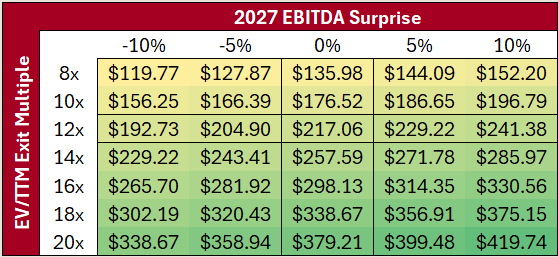
Source: Phi Research
In a worst case scenario, we find that BYD is roughly adequately valued. In a normal scenario, shares have large upside potential.
Conclusion
Although somewhat puzzling in the case of Boyd, the company has found itself under the microscope in regards to a number of issues which we do not view as legitimate or significant risks going forward. Trading at a long-term low on a relative basis and pricing in a total failure of what is a winning business model, BYD shares are likely as attractively valued as they have ever been.
Ultimately, Boyd is a company with a proven track record of acquisition execution, a management team who is capable of and well-motivated for continuing execution, and a long runway for continued acquisitive growth ahead. Boyd shops have a stable revenue base beneath them and no significant headwinds from a cost or competitive pressures perspective going forward. In the short-term, sentiments drive stock prices. In the long-term results drive returns, and even in the case that Boyd’s results are a disappointment, the returns will be significant. Strong Buy.