Superior Plus Corp. (TSX: SPB), The Basket Case for Value
Published on 2025-05-25
Superior Plus Corp. (TSX: SPB) is a leading North American distributor of Propane and Compressed Natural Gas (“CNG”). The company has recently laid a framework for a multitude of positive transformations which the market has not yet reflected in share prices. We view the opportunity as a classic value investment and think that shares offer an attractive risk reward proposition at current levels.
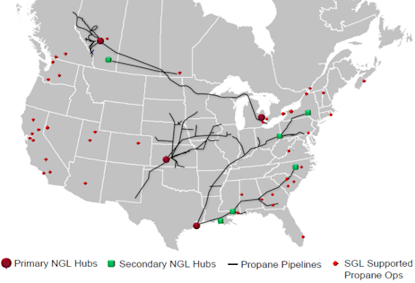
Superior operates through four major segments; U.S. Propane Distribution, Canadian Propane Distribution, Wholesale Propane Distribution, and Certarus; a recently acquired CNG business. Operations span across North America, with the company running over 2,100 delivery vehicles to ~750k unique customers.
Figure 1: Geograhic Distribution of Operations
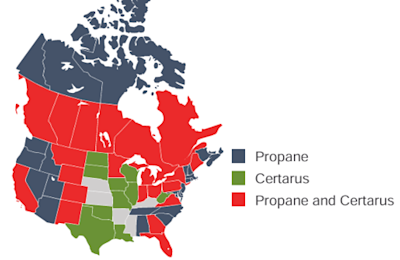
Source: Company Presentation
The U.S. Propane Distribution, Canadian Propane Distribution, and Wholesale Propane Distribution segments deliver propane to both consumers and businesses through Superior’s network of propane pipelines, delivery trucks, and other infrastructure. Businesses demand propane for heating, power generation, and the function of forklifts, automobiles, and other light machinery. Primary end markets include agriculture (machinery and heat production for drying crops), construction, mining, & restaurants. Consumer uses of propane include barbeque and heating element fuel, backup power generation, water heater function, and most notably home heating. For locations which are not tied in to the natural gas grid, propane offers consumers both the lowest cost and lowest emission solution to the above problems. The market for propane is highly fragmented, with Superior holding the largest market share relative to competitors at ~6%. The volume demanded for propane is expected to be relatively flat for the next five years. Figure two shows propane volume forecasts and a summary of market share distribution.
Figure 2: Propane Volume Forecasts & Market Share Summary
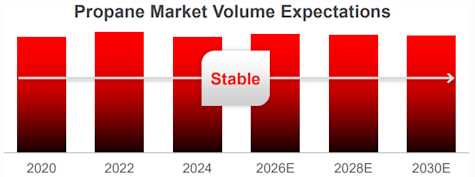
Source: Company Presentation
Superior’s Compressed Natural Gas segment also holds the largest market share in its respective markets. In contrast to propane, demand for CNG is expected to grow significantly in the coming years (see figure 3). Superior classifies its end markets for CNG into Wellsite, Utility Resiliency, Renewable Natural Gas, and Other. At the wellsite, CNG is used to power drilling and fracking machinery, with natural gas replacing diesel power generation as a lower cost and lower emission alternative. On the fracking side, the uptake of e-frac, dual fuel, and natural gas frac pumps is a major driver of growth for CNG demand. All three pump styles offer a more efficient alternative to conventional diesel frac pumps, and in the absence of natural gas wells which are immediately available at a location, CNG will be required for operation. CNG is also used for utility resiliency, and stands as a supplemental gas supply system during both planned and unplanned outages. Figure three shows a summary of Superior’s market share positioning and forecasts for CNG growth through to 2030.
Figure 3: CNG Volume Forecasts & Market Share Summary
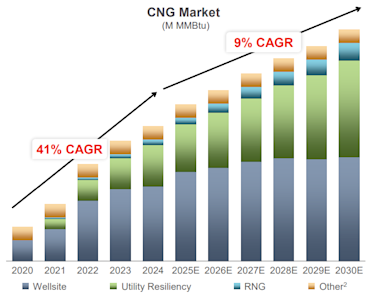
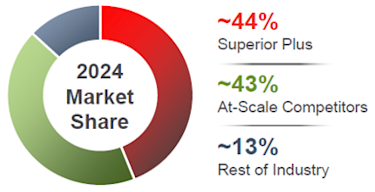
Source: Company Presentation
Recent History
Superior Plus has produced relatively stable revenues, EBITDA and free cash flow since the COVID-19 Pandemic. The company’s shares saw a significant appreciation in value in conjunction with the market’s recovery exiting the initial stages of the COVID-19 crash. In early 2022 growth associated with economic recovery slowed, interest rates were raised, and the outlook became weaker. From this point onward, shares traded relatively flat until approximately one year ago.
Figure 4: Historical Share Performance
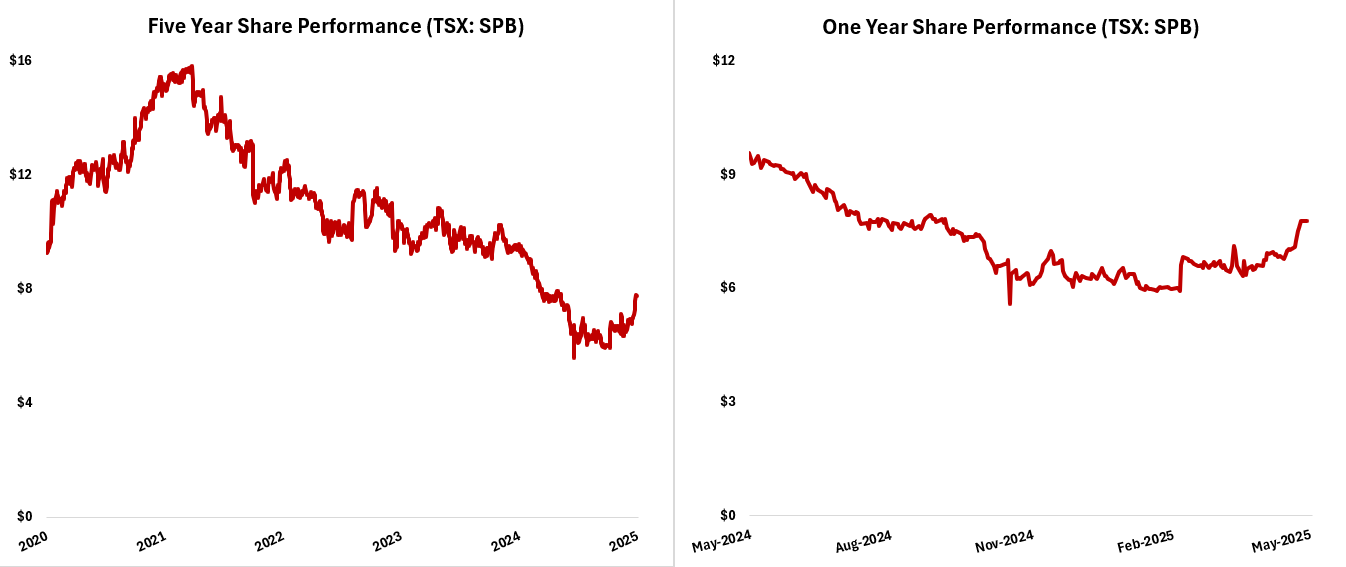
Source: S&P Capital IQ
The last year has provided poor performance for Superior’s shareholders. Although the company was able to produce record levels of EBITDA and show significant growth in margins, volumes delivered missed management’s guidance due to warm temperatures across North America which contributed to a low demand for consumer heating propane.
On April 2nd of this year, Superior Plus management presented investors with a new framework for growing EBITDA by ~$70M USD by 2027. This, alongside promising Q1 results published on May 13th, have created some positive momentum for the company.
Positive Catalysts
The Superior Delivers strategic plan is set to be a major positive change for a long unchanging corporation. The management team has highlighted three major pillars to drive growth in EBITDA through to 2027: 1) Leverage industry-leading cost-to-serve, 2) Take initiatives to grow and retain customer base, and 3) Use Superior’s vertical integration to create cost savings.
Industry-Leading Cost-to-Serve
Management expects ~$35M USD in EBITDA growth driven by this pillar of the strategic plan. One initiative driving this will be data-driven route optimization for delivery trucks. Superior ran a two-week pilot program in Southern Ontario to estimate cost savings, with initial findings showing a 14% decrease in miles driven per delivery and a 16% increase in gallons filled per delivery. An example of the route optimization being done is provided in Figure 5 below:
Figure 5: Data-Driven Route Optimization
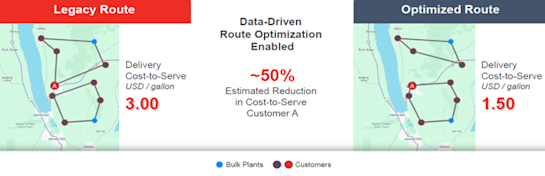
Source: Company Presentation
Another initiative which falls under this pillar of Superior Delivers is “Peak Shaving”. Demand for propane is somewhat seasonal, as one of the largest use cases in end markets is heating. Because of this, Q4 and Q1 of each year will often see a bottleneck for deliveries which increases average costs of serving. Management has assessed that ~12% of deliveries made in peak months have previously been to customers who were flexible to receive deliveries at any time of year, and ~53% were made to semi-flexible customers. Offloading these volumes to Q2 and Q3 can decrease cost-to-serve and accrete to margins immediately.
The last initiative under the Industry-Leading Cost-to-Serve pillar will be strategic closures of propane plants. Management estimates that they will decrease the number of operating plants by ~35% and associated plant-operating costs by ~50%. Plant closure savings will be offset by an increase in delivery costs of ~20%, creating net cost savings of ~10%. This initiative goes hand in hand with data-driven route optimization, which will allow the closing of plants to be more economical as truck-based delivery costs decrease.
Growth and Retention of Customer Base
One of the largest issues driving customer churn for the business is pricing. To combat this, Superior plans to offer pricing which is tied to customer economics, create data-driven fee structures, and create reward pathways for customers that take actions which decrease costs.
Superior also plans on pushing forward its churn prediction tools which automatically contact customers which are seen to be at risk. Churn predictions are made based on changes in pricing towards the customer, changes in volume demanded, customer tenure, services issues, the degree of competition in the market, and more. Based on the likelihood of churn, a customized plan is created to contact the customer. Initial results seen in the calendar year 2024 were promising, with 96% of customers contacted being retained versus only 63% of those not contacted.
The last important initiative under this pillar of the strategic plan is targeted marketing and sales. Superior plans to target areas with a high density of customers which are in proximity to a propane-plant. By increasing customer growth and retention in areas closest to plants, the company can decrease average delivery costs significantly and retain and grow their highest margin client base.
Management expects the above initiatives to create ~$30M USD in EBITDA per year by 2027.
Use of Vertical Integration
Superior is unique in its level of vertical integration in comparison to its competitors. The company owns and operates 16 wholesale terminals as well as a network of propane pipelines. Figure 6 shows a summary of Superior’s wholesale assets:
Figure 6: Superior Plus Midstream/Wholesale Assets
Source: Company Presentation
Superior expects to create ~$5M USD in EBITDA in 2027 over 2024 through the strategic use of its wholesale assets. The company plans to increase utilization rates on assets by distributing propane to third parties, while also taking advantage of arbitrage opportunities across markets. Additionally, Superior will employ logistics automation tools to lower SG&A costs and further optimize midstream operations.
In total, management expects to create an additional ~$70M USD in EBITDA in 2027 over 2024. We see the plan as a smash hit. Many of the initiatives are obvious winners and it is almost surprising that they have not previously been implemented. Superior Delivers will undoubtedly be a positive catalyst for the business going forward, but it remains to be seen to what degree this will translate to financial performance.
Corporate Governance and Management Alignment with Shareholders
Analyzing the degree to which a management team is aligned with shareholder values is one of the best tools for assessing the validity of financial targets. If the incentives are in place for financial targets to be reached, management is more likely to create attainable targets and exert the necessary effort to reach them. If compensation decreases as a result of missing said targets, there is additional reason to believe they will be reached.
Board of Directors
Superior has an adequately sized board of directors with ten members. The company has employed the separation of Chair and CEO and boasts 90% board independence. Superior has recently replaced three of ten previous directors, and we like the inflow of fresh perspectives. In aggregate, we think the board is credible and do not see any holes in their qualifications. Detailed profiles of board members can be found here: (link). Board members are required to own a significant number of Superior Plus shares under the company’s equity ownership plan (roughly 3x annual retainer). Not all board members have reached this target yet, however all are on track to do so.
Executive Compensation
We see a large number of positives in Superior’s executive compensation strategy. Executives are required to own a significant number of common shares and other related interests in Superior Plus which they are not permitted to hedge against. Figure 7 shows a summary of senior management equity ownership requirements:
Figure 7: Senior Management Equity Ownership Plan
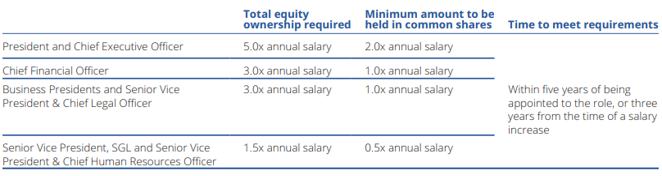
Source: Company Filings
Yearly compensation of senior management is largely based upon performance of SPB shares and the accomplishment of financial goals. Superior’s most preferred financial metric for short term compensation purposes is EBITDA, which we like as a proxy for free cash flow and is not susceptible to swings in working capital. Management is also compensated in the short term for decreasing capital expenditures and minimizing workplace injuries. Targets are set at the beginning of the financial year and may only be changed under extraordinary circumstances.
Superior employs the use of RSU’s and other grant style LTIP tools, as well as a newly minted stock option plan to create incentives for long term performance. Superior also has clawback provisions to disincentivize accounting or share price manipulation which balances well with the use of other LTIP and STIP tools. 75% of CEO pay is quantified as “at risk” and roughly 66% for other senior management. Figure 8 provides a summary of compensation plan distribution:
Figure 8: Executive Compensation Summary
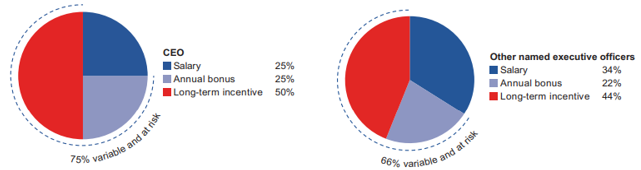
Source: Company Filings
Valuation
Given our confidence in the positive progression of the business thus far, we must now assess the intrinsic value of the shares and paint a picture of what the market is expecting from SPB. Shares closed on Friday, May 23rd at $7.96, trading at ~6.7x trailing twelve months EBITDA. This is near a five year low and well below the five year average of 9.3x.
Figure 9: Enterprise Value / Trailing Twelve Months EBITDA
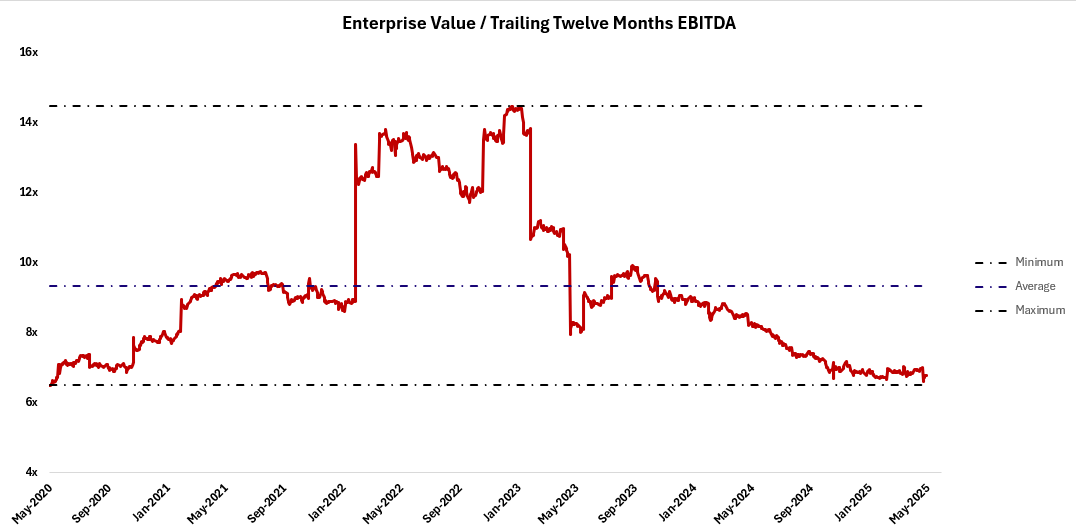
Source: S&P Capital IQ
On a multiples basis shares appear to be quite cheap. For a more comprehensive analysis we will use management’s financial targets to build a discounted cash flow model. Figure 10 shows both historical results and forecasts for 2025-2030 for cash flow relevant metrics. Note that all values shown are in millions of USD, in line with SPB’s disclosures.
Figure 10: Financial Forecasts – Management Estimates
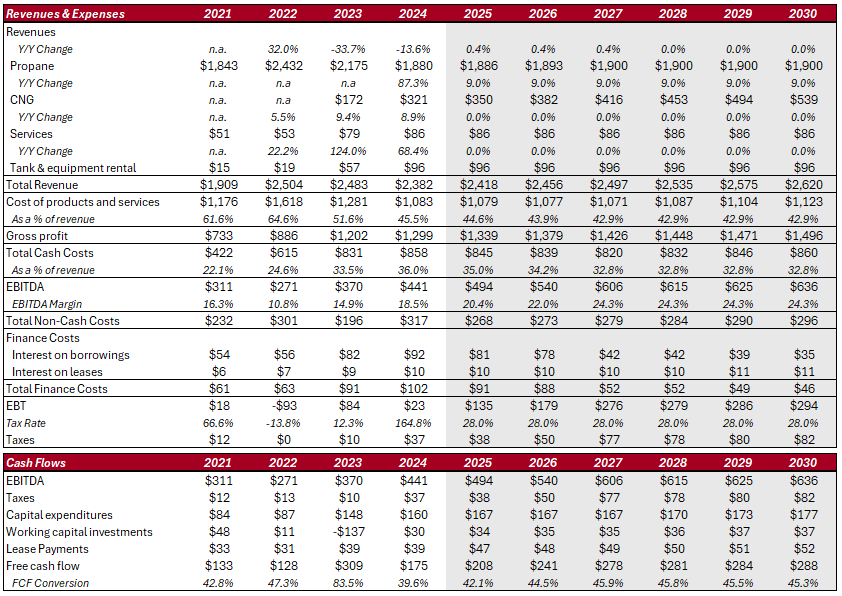
Source: Company Filings, Phi Research
Excluding the effects of growth in Certarus revenues, our forecasts are in line with management’s expectations for $70M USD growth in EBITDA from 2024 to 2027. We have distributed the impacts of such improvements into modest topline growth for propane revenues until 2027 (stemming from customer retention and growth initiatives), with the remainder being worked into both cost of products and services and cash costs. From 2027 onwards we assume zero growth in propane related revenues and 9% growth in Certarus until 2030, inline with management’s expectations. We also assume that margin profiles halt improvement after 2027 and remain relatively flat going forward.
For finance costs we haved analyzed and forecasted a debt repayment schedule under the assumption that management will use 25% of free cash flows to pay off debt, placing a priority on that which is highest interest. This is in line with managements capital allocation priorities which were stated during the April 2nd, 2025 investor day. Interest on leases are expected to grow at roughly inflation.
On the cash flows side, management has provided guidance for a total of $500M USD in both growth and maintenance capital expenditures from 2025-2027. Although we would prefer to exclude growth capital expenditures from our free cash flow calculation, no commentary has been provided on the percentage of future capital expenditures which are attributable to reinvestment. Ultimately, including this in our calculation will provide a more conservative estimate for share value. We have split this $500M USD capex estimate evenly across 2025-2027 and have forecasted for growth of roughly the inflation rate thereafter. Working capital investments have been estimated as a percentage of revenue and lease payments for 2025 are already scheduled and available in company disclosures, with us assuming that payments will grow at the pace of inflation thereafter.
We believe this model is reasonably reflective of management’s expected improvements in the business, and if anything is conservative. The Superior Delivers framework could easily provide greater improvements than the modest revenue, margin, and free cash flow conversion changes shown above.
Figure 11 shows our final discounted cash flow model. Free cash flows estimated in USD are converted to CAD using the covered interest rate parity. We have used the covered interest rate parity rather than the uncovered as SPB partakes in certain currency hedging activities. The covered interest rate parity is simply used to reflect differences in the inflation levels which current seven year risk free bonds reflect. Our weighted average cost of capital was calculated using the weighted cost of all Superior Plus debt and the Capital Asset Pricing Model for a cost of equity. For a beta we used a five year monthly calculation which brought us to a value of 0.39, implying that Superior is a more stable asset than the broad market. This aligns with intuition surrounding the business, as demand for propane shows little correlation with broad market declines and is akin to a consumer staple.
For an exit value we have used a growing perpetuity with a terminal growth rate of just 1%. We have also included Superior’s outstanding preferred shares in our share count, as management expects to convert these to common shares in short order (only ~300k outstanding).
Figure 11: Discounted Cash Flow Model – Management Estimates
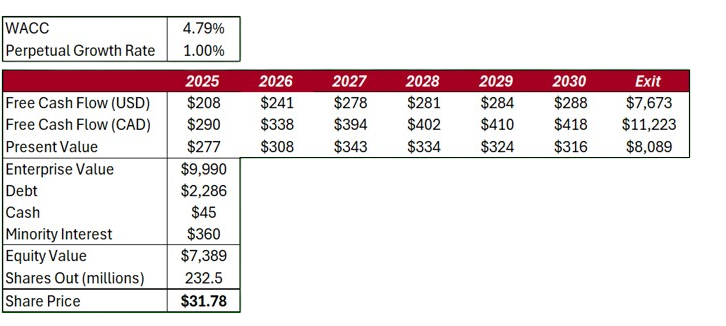
Source: Phi Research
Our model brings us to a share price of $31.78, nearly 300% higher than the last closing price of $7.96.
Alternative Scenarios
The above discounted cash flow model shows us that the market is not even close to appreciating the estimates which management has set out. For the sake of sensitivity analysis, we have constructed two additional models to paint a better picture of what share prices would be like in alternative scenarios.
Figure 12: Financial Forecasts – Alternative Scenario #1
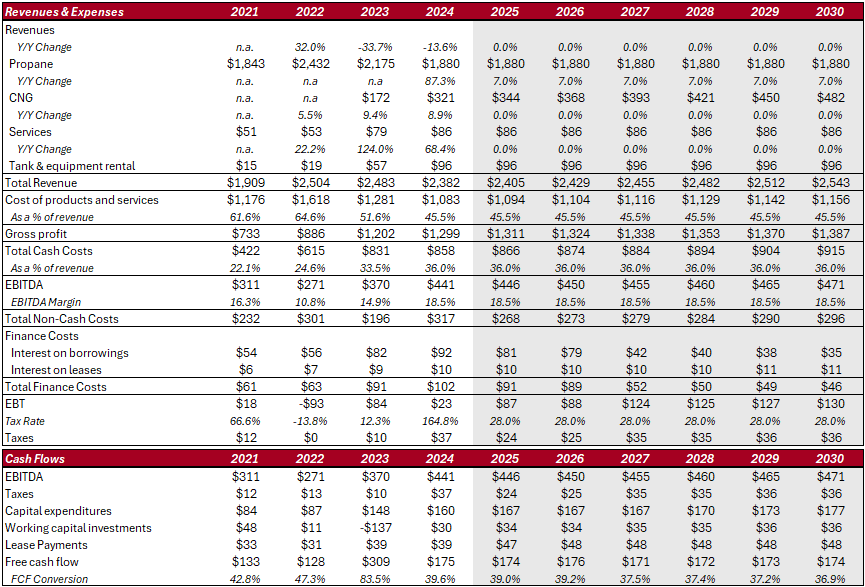
Source: Company Filings, Phi Research
Our first alternative scenario assumes that management’s targets are missed and that no improvements are made in the propane revenues space or in margin profile. Additionally, we assume that Certarus grows significantly slower than the broad CNG market at only 7% per year. Free cash flow conversion rates are expected to trail off as time goes on. Figure 13 shows our discounted cash flow model for this alternative scenario. The only major change made is in adjusting our perpetual growth rate to 0%.
Figure 13: Discounted Cash Flow Model – Alternative Scenario #1
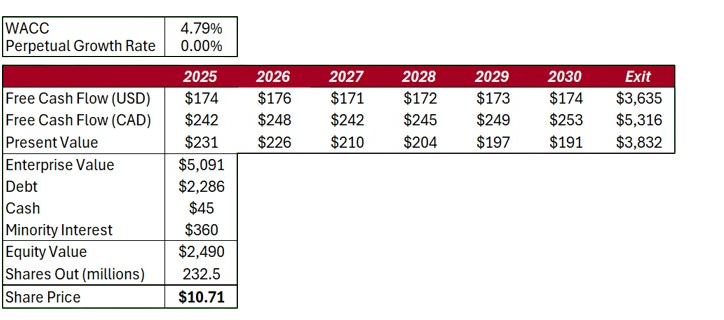
Source: Phi Research
Our discounted cash flow model now yields a much lower estimate for share price at $10.71 per share, which still purports that shares are currently undervalued by nearly 35%. This scenario shows very little faith in the Superior Delivers framework and managements estimates, both of which we believe have validity based upon the detail of the framework and the incentives which are in place for management to execute. The fact that this scenario still represents significant upside in share pricing is testament to the value offering which SPB shares currently offer.
Figure 14: Financial Forecasts – Alternative Scenario #2
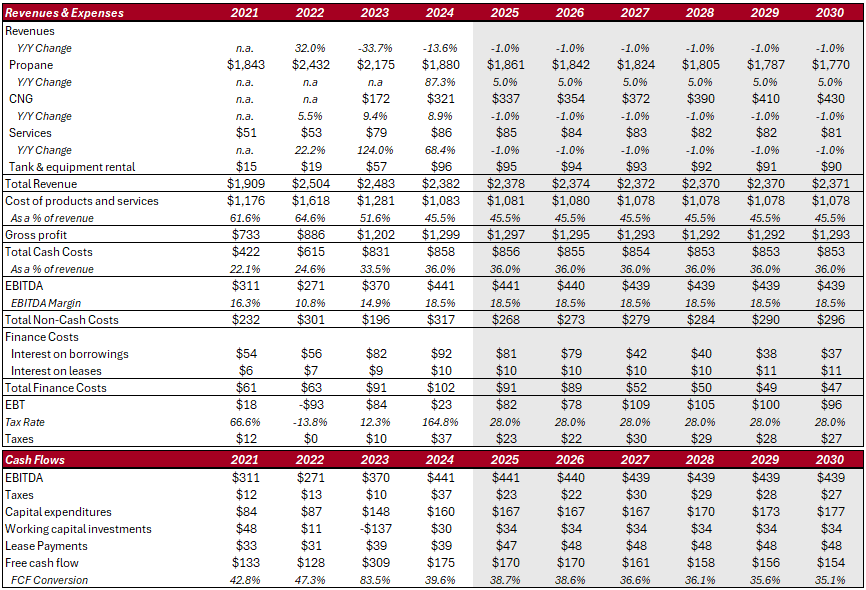
Source: Company Filings, Phi Research
Figure 14 shows our second alternative scenario. This scenario shows a complete failure of the Superior Delivers framework, with propane related revenues falling 1% per year and Certarus only producing 5% growth per year. Margins remain flat and free cash flow conversion falls to pitiful levels by 2030.
Figure 15: Discounted Cash Flow Model – Alternative Scenario #2
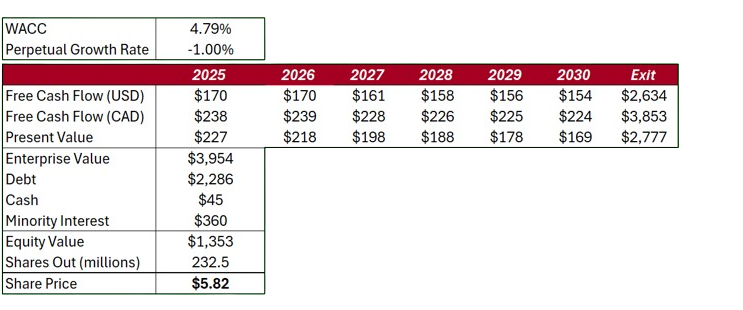
Source: Phi Research
Our discounted cash flow model now uses a perpetual growth rate of -1%, representing significant pessimism for SPB cash flow generation past 2030. This approach brings us to a share price estimate of $5.82, ~27% lower than current share prices. We see this outcome as highly unlikely and overly pessimistic. Of the three scenarios analyzed this outcome would appear to be the least likely and offers the smallest absolute value in share mispricing. Thusly, we can conclude that SPB shares offer significantly higher upside than downside, and even if management’s targets are missed there is still opportunity for significant capital gains.
Summary and Investment Decision
When we look at Superior Plus we see three things:
1) A company trading at a historically low EV/EBITDA multiple.
2) A market who has not priced in the modest financial estimates laid out by management.
3) A competent management team who is aligned with shareholders and has a well defined, palpable plan for success.
Superior Plus is a textbook case of value investing. The Superior Delivers framework has put the mechanisms in place for significant margin expansion and free cash flow growth in the coming years. Our valuation exercises have shown that even if management is to walk off the proverbial fairway (or even hit it in the water) the shares are roughly adequately valued at worst, with massive upside if financial targets are reached. Considering the conservative nature of such targets and the incentives which are in place for them to be executed, we have faith that they will indeed be reached and shares will outperform the broad market by a large margin. Strong buy.