Top Down Analysis – Picks & Shovels: GE Vernova Inc. (NYSE: GEV) & Bloom Energy Corporation (NYSE: BE)
Published on 2025-09-10
Burgeoning investment in Artificial Intelligence infrastructure and the reindustrialization of the United States is poised to deliver an extended period of unprecedented power demand growth. On the private side, Artificial Intelligence provides the opportunity to realize the greatest business model in history. On the public side, both AI and reshoring production are a significant national security concern in a geopolitical environment ripe with rising tensions. The background of aging North American power infrastructure creates the opportunity for explosive and long term growth in the power supply business, and as top ideas to play on the theme we have selected GE Vernova Inc. (NYSE: GEV) & Bloom Energy Corporation (NYSE: BE).

Let’s imagine that you are reading this report in your office, which is ~500 square feet in size. If we decided to fill your office space with cabinets of traditional CPU’s, those which can be found in a standard computer, your office would consume ~130kW of power. This amount of power is equivalent to the power demand of over 100 U.S. homes. Now let’s say that instead of traditional CPU’s, we fill your office with Nvidia’s cutting-edge Blackwell GPU’s. This change in chip will increase your office (or mini data center’s) power demand to 13 times the level demanded by CPU’s, now roughly equivalent to the power demanded by 1,300 U.S. homes. Now let’s say you get your hands on some Nvidia Rubin units, which are scheduled for release in 2026; your office’s power demand increases once again by sixfold. This equates to an equivalent power demand to nearly 8,000 U.S. households in a space the size of your office. We can now comprehend Meta’s planned Richland Parish, Louisiana data center which is poised to consume ~2,000,000 kW. That is over 1.5 million U.S. homes in equivalent power at a single facility. For reference, estimates have the total number of homes in the United States at ~150 million.
Figure 1: Meta Richland Parish Data Center Rendering

Source: Data Center Dynamics
The Artificial Intelligence Arms Race
Meta’s Richland Parish campus is estimated to cost ~$10B, only a fraction of the company’s expected $72B of capital expenditures for this calendar year which are being put towards Artificial Intelligence infrastructure and associated model development. The Richland Parish campus was funded as a part of a $29B private credit agreement with PIMCO and Blue Owl Capital, reflective of the AI frenzy which has rocked investors ranging from your cousin and grandparents to Blackstone and Apollo. Meta is not alone in their skyrocketing spend on Artificial Intelligence development. In conjunction with Amazon, Alphabet, and Microsoft, a total of $320B is expected to be put towards AI technology development and data center buildout in this calendar year. This is up nearly $100B from 2024 levels, and nearly three times higher than 2023 spending.
Figure 2: Core-Four Hyperscaler Capex Levels
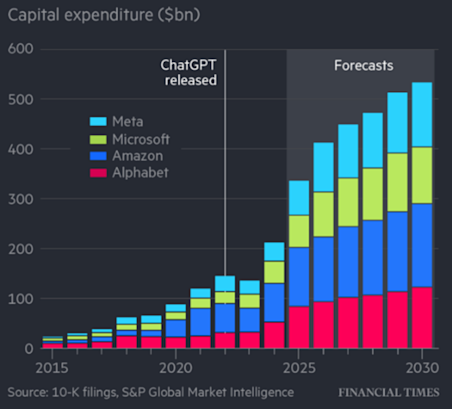
Source: Financial Times
Capex levels show no sign of slowing down as technology companies pursue the ultimate goal; Artificial General Intelligence (AGI). The core-four hyperscalers alone will commit trillions of dollars within the next five years, on top of OpenAI’s $500B Stargate Project (four year time-frame), and a slew of other peers like Apple and CoreWeave investing in other multi-billion dollar projects. As a technology investor, it is easy to fear that we may be seeing overcommitment from these firms, and it is a real possibility. Legendary VC, Sequoia Capital, published a short but interesting piece on this which we recommend investors read (link). The reality of the spending commitments being made is that they are, for the most part, long term, meaning that technology firms are entrenched and essentially all-in on receiving massive returns on these investments. If you are a firm who decides not to escalate your investment at a time in history where we are on the cusp of the greatest technological advancement ever made, you are likely to go extinct in the near term. If you are a firm who invests at a higher rate than your peers and succeeds in creating a superior product, you will become the most successful and profitable business in history. The result of these conditions is firms leaning towards a “more is better” attitude on AI capital expenditures. Figure 3 provides a game theory analysis of the expenditure dilemma which tech firms currently face:
Figure 3: Game Theory Analysis of AI Infrastructure Spending
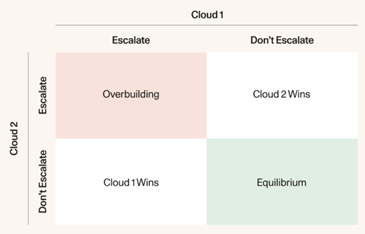
Source: Sequoia Capital
The Incentive for Investment
For as easy as it is to assume that tech firms are overcommitting, the reality is that this is an arms race for a reason. Artificial Intelligence is already the most advanced and arguably the most useful piece of technology in the history of mankind, and according to experts, we are only at the beginning of the journey. Alexandr Wang, Meta’s Chief AI Officer and founder of Scale AI (also the youngest billionaire in history), has gone on the record to say that humanity will be able to develop Artificial General Intelligence (AGI) within a decade. OpenAI’s Sam Altman has made similar comments, stating that “We are now confident we know how to build AGI as we have traditionally understood it” and that he believes physical AI will be present by 2027. For those not aware, AGI is a form of Artificial Intelligence which has an infinite scope of work, exhibits human-like learning and reasoning capabilities, and is highly adaptable. AGI would be (or potentially, will be) the most successful business model ever created. AGI does not simply replace menial jobs, it replaces people in the mines below our feet and the planes above our heads. It replaces roughnecks and frac operators, academic researchers, equity researchers (gulp), your waiter and waitress and bartender and hostess. It is both the cops and the robbers, and the getaway car with a mind of its own. It cleans your house and walks your dog and takes your kids to hockey practice. There is no limit to where the technology could be employed, and ultimately it even replaces most of the people who worked on its own source code. From drug discovery to mathematics to flipping burgers; the use cases and associated value of AGI is incomprehensible, and the demand would undoubtedly be insatiable. The total addressable market is arguably larger than the current GDP of the entire planet, and the investment which we are seeing from technology firms today is testament to their belief in this thesis. It is a bridge to utopia, and according to big tech, it is within reach.
Regardless of if or when firms are able to reach their goal of developing AGI, continuing improvements in current Artificial Intelligence can create massive opportunities for value creation and subsequent profits. In spite of how far away our current technology is from AGI, tech firms have been reporting record numbers consistently since beginning spiking capex levels. In the past two years, the average year-over-year growth in TTM EBITDA for the core-four hyperscalers has been ~30%. Combine this with the fact that, in our view, current AI is criminally underutilized, and there is a clear path to successful return of capital. Figure 4 shows the year-over-year change in TTM EBITDA for each of the core-four over the past two years, broken down by quarter.
Figure 4: Core-Four Hyperscaler EBITDA Growth
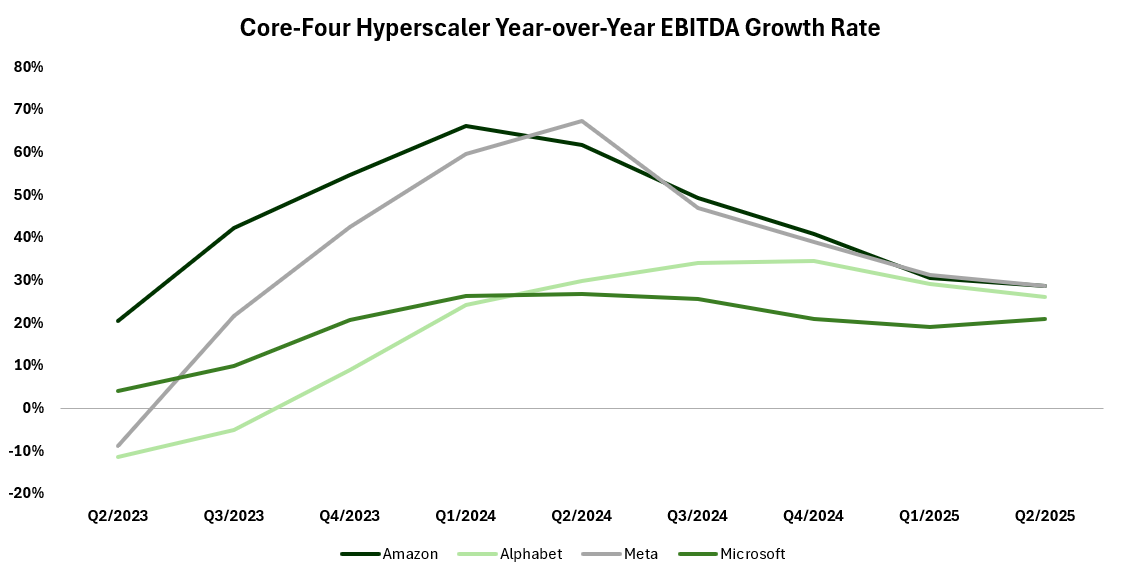
Source: S&P Capital IQ, Company Filings, Phi Research
What this demonstrates is that even current weak AI delivers tremendous value, and in the eyes of the tech firms, more investment will mean better technology and more growth. The model is proven, but the technology is far from optimized. The buildout begins.
The Power Pinch
While discussing Nvidia’s Blackwell GPU during a keynote speech, Nvidia’s CEO Jensen Huang made a very blunt statement in regard to the power demand of Artificial Intelligence: “… every single data center in the future will be power limited. Your revenues are power limited. You can figure out what your revenues are going to be based on the power you have to work with. … We are now a power limited industry”. The irreverent Elon Musk, founder of xAI and a number of other technology companies, has made similar comments. In an interview with CNBC in May of this year, Musk predicted that AI developers are going to begin facing power sourcing problems by the middle of 2026. “My guess is people are going to start hitting challenges with power generation maybe by the middle of next year, end of next year.” “As we solve the transformer shortage, there will be the fundamental electricity generation shortage,”. In February, Alphabet warned that the U.S. is facing a power capacity crisis, with Google running into the harsh reality that “we (don’t) have enough capacity on the system to power our data centers in the short term and then potentially in the long term,”, as per Caroline Golin, Google’s global head of energy market development.
As we discussed earlier, power intensity of AI technology is ever increasing, and it is clear that current infrastructure is not prepared to support the AI investment boom and the subsequent power demand spike that is to come. All of this comes at a time where American effective tariff rates are higher than they have been in nearly a century, the U.S. Dollar Index is down over 9% year-to-date, and as a result the pressure to reshore industrial operations is higher than it has ever been. Figure 5 shows the explosive growth in annual U.S. reshore jobs created. Over the last 15 years, the number of annual reshored jobs has grown at a ~25% CAGR, from just over 10,000 annual job adds in 2010 to ~250,000 in 2024. We expect this trend to continue as a function of the current macroeconomic environment, continuing positive trends in automation which lower the cost spread between domestic and offshore manufacturing, and government policy support.
Figure 5: Growth in Reshoring Activity
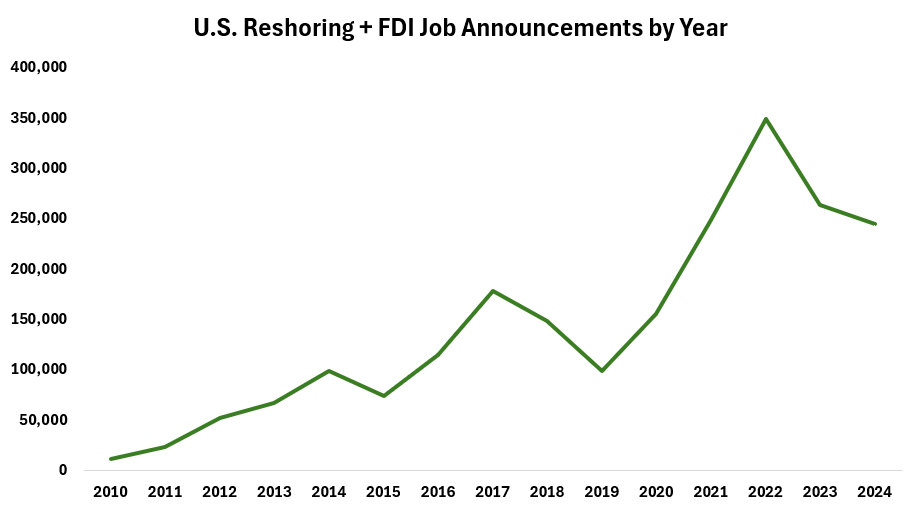
Source: Reshoring Initiative, Phi Research
Another interesting metric to analyze in regards to reshoring activity is the amount of American domestic construction in the manufacturing area. In the past 5-6 years, monthly spending on manufacturing-based construction has nearly tripled ($226B this June compared to $82B in June of 2019). This growth far outpaces the total growth in all United States construction spending, which has only increased by ~55% in the same period. We believe these changes are reflective of increasing reshoring activity and the success of government policies which incentivize the reindustrialization of the United States. This is a trend which is only set to intensify with the current administration. Figure 6 shows recent changes in U.S. domestic construction spending:
Figure 6: Growth in Manufacturing Based Construction Spending
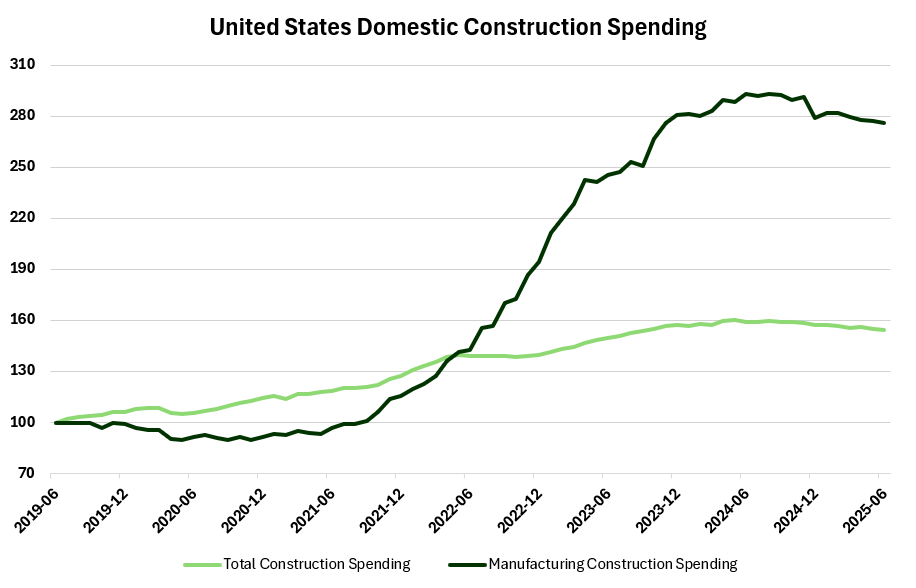
Source: FRED, Phi Research
The result of the above reshoring activity, reindustrialization of the United States, skyrocketing growth in power demand for AI, and various other trends in electrification such as electric vehicle adoption has been an unprecedented rise in electricity prices. Although recent electricity inflation is partially attributable to widespread inflation in the post-COVID years, electricity price increases have far outpaced those seen in other goods categories. Figure 7 shows a direct comparison of the U.S. CPI for electricity and the combined all items basket over the past seven years. Since 2018, electricity prices have increased by nearly 40%, compared to the all items basket at ~28%.
Figure 7: Increasing Electricity Prices
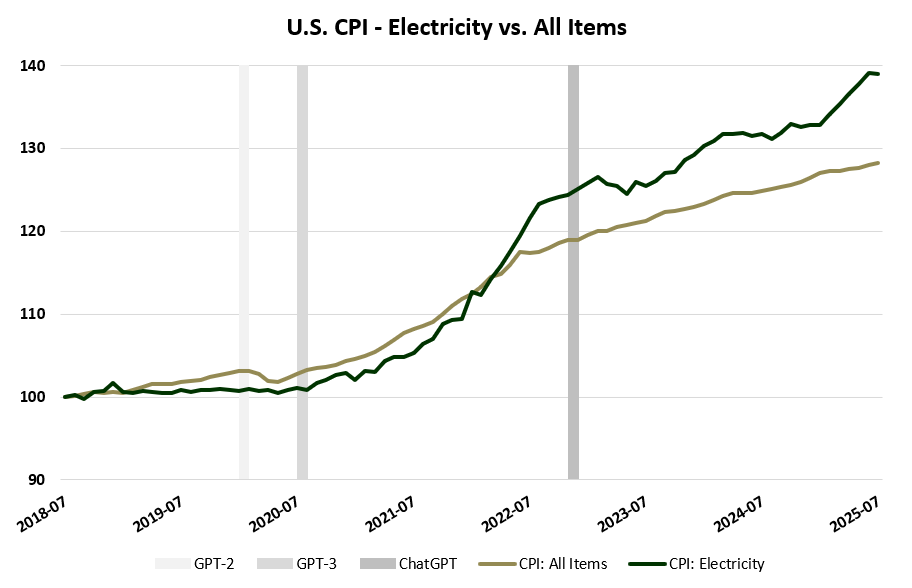
Source: FRED, OpenAI, Phi Research
Figure 7 also shows the release dates of OpenAI’s GPT-2, GPT-3, and GPT-3.5 (i.e. ChatGPT). For reference, GPT-2 was trained with an estimated 1.5 billion parameters, which is dwarfed by the GPT-3 and GPT-3.5 models which operated on an estimated 175 billion parameters. This is testament to the incremental scale and model complexity which is required to continue making technological progress, and the downstream effect of higher model complexity is a higher requirement for power. GPT-4, which was released in March of 2023 was estimated to have utilized over 1 trillion parameters, and GPT-5, the latest and greatest released in August of this year, is estimated to be in the magnitude of 2 trillion parameters.
Ultimately what we see is that the United States does not have sufficient power infrastructure in place as of right now, and it would appear that the experts agree. Based on the trends which are present, the tightness in the electricity market will only get worse from here, and an all-hands-on deck approach will be employed to attempt to meet future demand.
National Security Concerns
It is evident that the United States needs power badly, and if we know the United States government, we know that they seek to fulfill their desires fiercely. There are two main reasons for the current lack of power infrastructure to be a concern to the United States government: 1) insufficient electricity supply will stymie reshoring and reindustrialization policies and 2) it is crucial to national security that the United States have control over the strongest Artificial Intelligence, both now and in the distant future. Just as the development of AI is an arms race for the technology firms, it is the same for geopolitical players. When we consider the value which AI can create for an economy, the strength it can provide to a military, and the improvements it can provide to our quality of life, it is clear that to maintain their position at the top of the geopolitical food chain the United States must pursue the technology’s development aggressively. In a July 23rd speech which was delivered in conjunction with the signing of the United States AI Action Plan Executive Orders, President Trump made it clear that “America is going to win [the race].” Although the speech is somewhat convoluted and lacks focus, it is an interesting listen and demonstrates the degree of dedication which government is bringing to the situation (link). “As with any such breakthrough, this technology brings the potential for bad as well as for good, for peril as well as for progress, … We must ensure that it is pioneered first and best [by the United States]”. The United States goal with Artificial Intelligence is to be the global leader, and the force which enables the accomplishment of this goal is establishing sufficient power supply.
On April 8th, 2025, President Trump signed a trio of Executive Orders aimed at enabling power supply development (mainly to account for spiking data center demand). The goal of the EO’s signed was to halt the retirement of legacy power generation assets, decrease restriction on the domestic coal industry, and to eliminate any state or local government powers which would prevent any energy related projects from passing regulatory approval. Ultimately, the Executive Orders are aimed at slashing any and all regulation which would prevent power supply from increasing, even if it means promoting the lowest common denominator in coal.
Top Down Thesis
It is undisputable that power production levels in the United States will increase for the foreseeable future. Comments from Jensen Huang have confirmed that access to power will be the largest determining factor behind the revenue generated by AI projects, revenue which is ever expanding and is seeing unprecedented levels of investment to be pursued. On the public side, government is well aware of the requirement to support AI development and the role which energy stability and power supply growth will play. Regulatory barriers are falling and public support is growing, all backstopped by a push for reshoring and reindustrialization which is expected to drive additional tightness in electricity markets.
In spite of the success which AI investment has seen thus far, there are a number of sceptics who believe that we are in some form of tech bubble. The reality is that regardless of the validity of this perspective, there is limited impact on growth in power demand. Even if the AI investments made over the next five years do not generate the returns which were expected, the same arms race we have discussed thus far remains in place and the scale of projects will only be pushed farther in pursuit of AGI or a like technology. In a certain respect, it may actually be better for power suppliers if the development of strong AI takes longer, as this prolongs the growth phase for power demand and increases the aggregate demand once a “final model” is reached. Other sceptics may reference the release of DeepSeek, where a Chinese entity made significant progress towards lower training requirements from both an electrical power and computing power perspective. The reality is that DeepSeek is not a top performing model and that the model’s inference power requirement is approximately the same as that of peers. Although model training is power intensive and often catches headlines for that reason, the reality is that it only accounts for ~5% of a model’s lifetime power demand. This was the case for GPT-3, a model which was only in intensive operation for ~2 years. If somehow model training requirements fall off a cliff, as the entire market seemed to assume they would on January 27th of this year (and, ironically, not at all on any other day), this simply means that the creation of stronger and more useful models will be more rapid, and thusly there will be greater demand for inference which drives nearly the entirety of power demand.
It does not matter if Artificial Intelligence progresses faster, slower, or exactly in line with current consensus expectations; staggering amounts of power are required to fuel it. Artificial Intelligence is a gold-rush kind of theme, and when everybody is looking for gold, regardless of if they find any, it is a good time to be in the picks and shovels business. This is how we view power supply at present, and as a result we believe there are very attractive investment opportunities in the space.
Target Selection
Our goal is to select target investments which have significant exposure to the trends we have discussed and which also meet our standard three pillars of a quality long term investment; 1) a strong management team and good corporate governance scene, 2) a competitive business model or moat, and 3) attractively valued shares. Based on our assessment, we have discovered two companies whose shares fit the bill. For each company we will discuss the first two pillars individually, and then we will jointly discuss valuation as it is a somewhat autonomous subject.
Bloom Energy Corporation – (NYSE: BE)
Bloom Energy Corporation is a manufacturer of modularized, solid oxide style fuel cells which are referred to as “Bloom Energy Servers” or “Bloom Boxes”. Bloom’s proprietary fuel cell technology produces electricity using natural gas or hydrogen without any combustion reaction. The Bloom Box instead simply enables an easily sustained electrochemical reaction between oxygen and the fuel source which drives the flow of electrical current. As a result, Bloom Boxes emit negligible amounts of pollutants like NOX or SOX and only a small and concentrated stream of CO2 which is optimal for CC&S in the case that it is employed, all while running at higher efficiency levels than gas turbines or generators and producing essentially zero noise. Figure 8 shows a 20 MW installation of Bloom Boxes:
Figure 8: Bloom Boxes
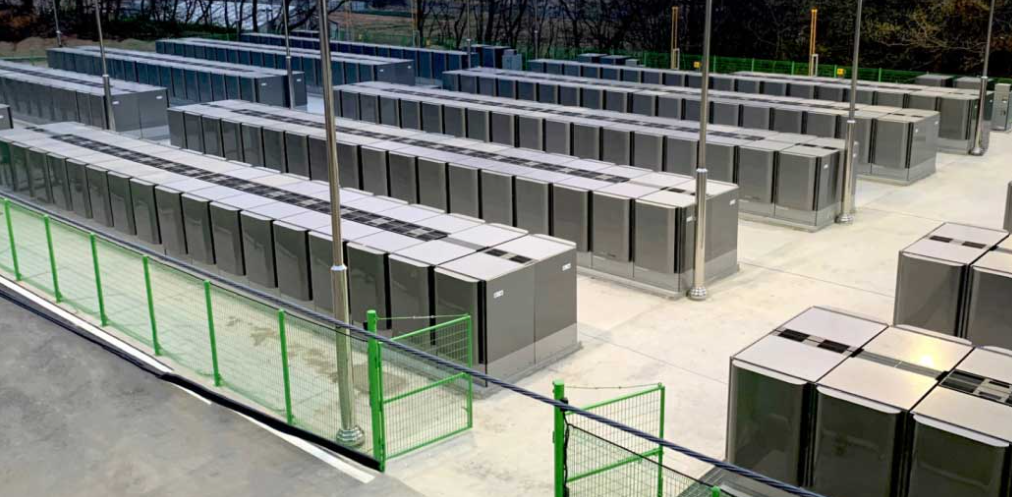
Source: Bloom Energy
Because of the modular nature of the product, Bloom is able to meet the power requirements of any size of project with full install completed in a 90-day period. This is insurmountably faster than accessing power via utility company and grid tie-in, which in most major markets is estimated to take 3-5 years according to utility representatives. A mid-year survey conducted by Bloom found that there is a significant disconnect between data center operator expectations for the timeline for grid power access, with operators expecting to receive power much faster than utilities expect to deliver it. Figure 9 shows a summary of the data collected by Bloom:
Figure 9: Time-to-Power Disconnect
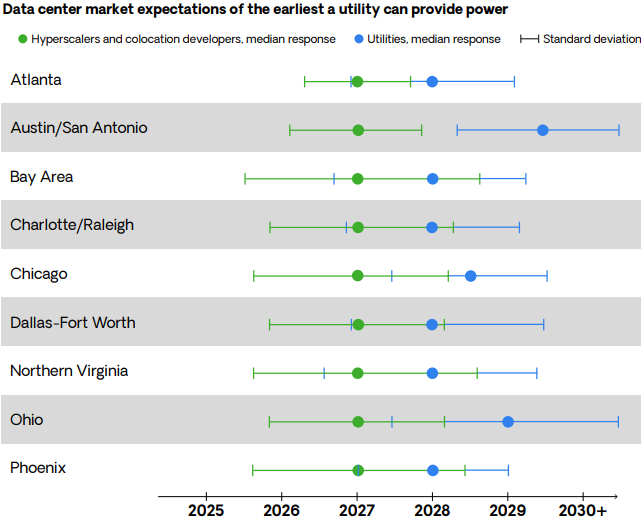
Source: Bloom Energy
As a result of this disconnect in expectations and the extensive timeline required to secure grid power, interest in “islanded power solutions” or “on-site power” is growing significantly. Bloom’s April 2025 survey also found that the number of data centers which expect to use on-site power grew to 37% from 13% in April of 2024, and that over a quarter of data centers now expect to use exclusively on-site power generation in 2030 as compared to the expectation for only 1% of data centers in the April 2024 survey. This is the niche which Bloom is able to fill; a data center operator who needs clean and efficient on-site power quickly. Bloom is years faster than utilities and other on-site power alternatives, and as a result is seeing significant growth in orders. Additionally, Bloom Servers are installed on skids and are easily mobilized, further establishing competitive advantage as data center operators are able to purchase Bloom Servers, establish grid connection over time, and then relocate their Bloom Servers to a new location as needed.
Another key selling point in power solutions to data center clients is reliability and uptime consistency. Compared to other green solutions like wind and solar, Bloom Boxes are not subject to any cyclicality in power production output. Bloom Boxes also support superior uptime operation as their modular nature allows maintenance to be conducted box by box, rather than undergoing a full system shutdown like would be the case with competitor solutions. On site power is also inherently more reliable than grid connection, as Bloom Boxes are less susceptible to destructive weather events and will never be cut off or limited due to aggregate power demand being too high. As a result of these factors, utility companies and governments have actually installed Bloom Servers as backup power in the case of a natural disaster or grid overload.
Thanks to their product superiority, Bloom has secured orders with both CoreWeave and Oracle for data center operations, which we believe significantly derisks the technological aspect of the investment. Bloom has also secured an agreement with the American Electric Power Company (AEP) for up to a gigawatt of fuel cells which they confirmed on their Q2/2025 conference call that they are continuing to pursue the deployment of, among other positive comments regarding Bloom’s tech. AEP has employed the use of Bloom fuel cells at both AWS and Cologix sites, with planned grid connection expected to be achieved in a 5-7 year timeframe at which point the fuel cells will be mobilized and reapplied to new projects. Bloom is currently beginning a plant capacity expansion which will double the company’s installed wattage capacity by the end of next year (fully funded, ~$100M cost). For reference, current capacity is estimated to be double current output, meaning management expects output to quadruple in the short term.
Corporate Governance and Management Alignment with Shareholders
Bloom is headed by Dr. KR Sridhar, founder, CEO and Chairman. Prior to founding Bloom, Sridhar completed both a master’s of Nuclear Engineering and a PhD in Mechanical Engineering at the University of Illinois, Urbana-Champaign, a top ranked global engineering campus. Sridhar also previously served as Director of the Space Technologies Laboratory at the University of Arizona, where he was also a professor of Aerospace and Mechanical Engineering. Under his supervision, the Space Technologies Laboratory won multiple R&D contracts for the exploration of and flight experiments to Mars. While working as an advisor to the NASA Mars Program Sridhar helped in the conversion of Martian atmospheric gases to oxygen for propulsion and life support purposes. Sridhar also serves on the External Advisory Board at Caltech’s Resnick Sustainability Institute and the Board of Visitors at the Grainger College of Engineering at the University of Illinois, Urbana-Champaign. Dr. Sridhar also boasts a successful career outside of academia, both serving on the board of C3.ai and as a strategic partner and special advisor to venture capital firms Kleiner Perkins Caufield & Byers and New Enterprise Associates respectively. The remainder of Bloom’s leadership team is decorated with extensive engineering experience, both in academia and in the private sector, with a multitude of individuals who have completed graduate studies in relevant fields which contributes to the technical success and competitive advantage of the Bloom business. The management team also exhibits exceptional experience in the manufacturing and procurement space, engineering and technical project management, utilities, legal & government relations, investment banking, corporate development, and more. Full management profiles can be found here (link).
Bloom’s board consists of eleven directors, an appropriate headcount for a company of this size and structure. Overall, we believe that the board is well qualified for both advising and overseeing management, with a broad skillset in relevant fields. Notable mentions include Jim Snabe, previous co-CEO of SAP, Michael J. Boskin, who served as Chairman of President George H.W. Bush’s Council of Economic Advisers from 1989 to 1993, John Chambers, who served as Chairman and Executive Chairman at Cisco Systems and has since founded venture capital firm JC2 Ventures, Jeff Immelt, who served as the Chairman and CEO of General Electric for sixteen years, Gary Pinkus, who is the McKinsey & Company chairman of North America, and Cynthia Warner, previous President and CEO of Renewable Energy Group as well as executive at a number of oil & gas companies.
Nearly the entirety of Bloom’s executive compensation is made up of RSU’s, PSU’s, or PSO’s (performance-based stock options). We like this structure as it both awards the accomplishment of concrete, non-share-based targets in the long term while also driving significant insider ownership. Figure 10 provides a summary of CEO and non-CEO NEO compensation for 2024:
Figure 10: Bloom Energy Corporation Executive Compensation Summary
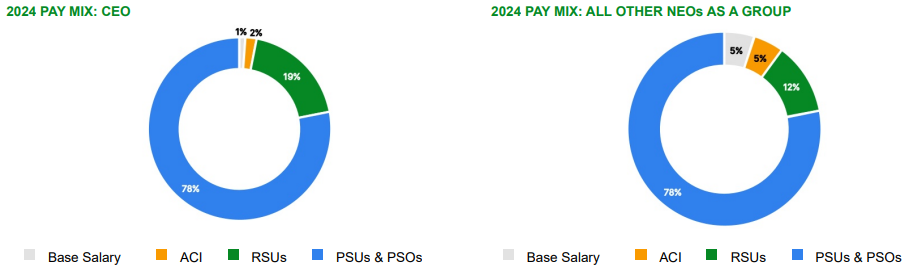
Source: Company Filings
In general executive compensation ticks all of our boxes in that it is competitive with the market, motivates strong financial performance in the short and long term, and strategically aligns management and the board with shareholders.
GE Vernova Inc. – (NYSE: GEV)
The second target investment we have identified is GE Vernova Inc. (NYSE: GEV). GE Vernova is the result of the breakup of the infamous conglomerate General Electric into three distinct entities, with GE Vernova representing General Electric’s power generation, wind, grid electrification, and digital solutions businesses. GEV is highly diversified in the power space, with product offerings ranging from heavy-duty and aeroderivative natural gas turbines, to grid stabilization software, to small modular nuclear reactors and both onshore and offshore wind turbines. As a result, the company has significant exposure to the key themes we have outlined throughout this report. In the following sections we will provide a breakdown of the products and services offered by GEV.
Gas Power
GEV manufactures and sells a suite of natural gas turbines ranging in size from 34.4 to 1680.0 MW which drives the bulk of its financial performance. In conjunction with the turbines, GEV offers parts and servicing as well as the ability to offer customized solutions such as combined heat and power solutions, CC&S technology, combined cycle solutions including steam turbines, and optionality for hydrogen fueling. Turbines are sold to utilities, governments, and corporations alike, with a significant amount of heavy-duty and aeroderivative turbine demand stemming from data center operators. Vernova turbines exhibit industry leading efficiency levels and startup times when compared to peers, and as a result the company has over 55 GW in backlog secured for the division. Figure 11 shows a heavy-duty gas turbine in construction:
Figure 11: GE Vernova Heavy-Duty Gas Turbine
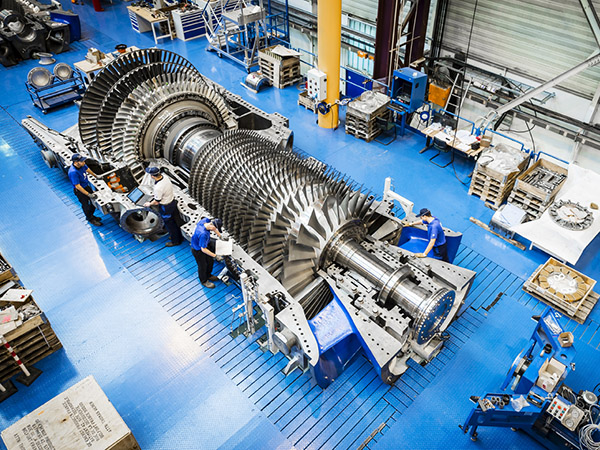
Source: GE Vernova
Vernova’s backlog in the gas space is extremely tight, with the company essentially “sold-out” for the next three plus years. Customer discussions are largely being held in the context of 2029-2030 delivery, and as a result GEV is seeking various capacity expansion projects, including the doubling of facility capacity at the Charleroi, PA factory and the doubling of labour hours at recently acquired Woodward assets. In accordance with these expansion plans, GEV expects turbine manufacturing capacity to grow from 55 turbines per annum to 70-80 by late 2026, amounting to ~20 GW of power supply delivered yearly.
Electrification Software and Grid Solutions
Given the changes in power demand we have discussed thus far, it is fair to assume that moderation and monitoring of the grid will continue to be a significant challenge faced by utilities and government for two reasons. The first is the growth in power outages and rolling blackouts, a result of both major weather events and instances of power demand exceeding power supply. From 2013 to 2022, power outage frequency increased by ~20% in the United States, with outage duration up by ~46%. From the early 2000’s to 2023, power outages increased by ~64%, pushing the United States to endure more blackouts than any other developed nation. The second is the growth of renewable energy, which often produces power intermittently and thus requires stabilization and moderation techniques to match supply to demand (think wind power which only produces when wind is present or solar which produces variable output based on daily and seasonal fluctuations in sunlight). In short, increasing instances of power demand exceeding supply, growth in extreme weather events, growth of variable output power sources and general tightness in the utilities market create conditions which require increasingly sophisticated grid moderation techniques. This is a problem for which GEV has solutions.
Vernova’s electrification software is designed to meet the need for grid orchestration, minimizing disruptions and consistently aligning supply and demand. The electrification software provides real time insights into power asset outputs, while also running simulations and predicting both supply and demand loads with accuracy. Additionally, GEV offers software which can be used to automate the inspection of industrial power assets using AI and Machine Learning techniques. In conjunction with their electrification software, GEV offers systems which assist in the manual moderation of power supply (grid solutions), including battery energy storage systems which store and release power as needed to assist in peak-shaving, and a variety of other technologies designed to provide voltage support, improved power quality and consistency, and optimized flows of electricity. The combination of the physical infrastructure needed for grid moderation and the software to operate and monitor power generation assets forms an attractive value proposition for customers in a growing market.
Nuclear
Nuclear power, especially in the form of small modular reactors (SMR’s), is a leading prospective solution to mounting power problems especially in the context of data centers and other demanding islanded power settings. Small modular reactors offer 24/7 uptime and can produce a tremendous amount of power in a very small area as compared to other solutions. The expectation for the success of SMR’s is visible through the value of equities like Oklo and NuScale Power, which are both essentially pre-revenue. As it stands, regulatory hurdles are the main challenge to nuclear power, which we expect will continue to become less of a challenge as corporations establish SMR power, technology improves, and governments realize their merit, a process which is already well underway. The other challenge is unit economics; nuclear power is significantly cheaper than alternatives once constructed due to the amount of power produced by a small amount of radioactive material, however when including upfront capital costs natural gas solutions are significantly cheaper. SMR manufacturers expect upfront costs to fall by a large margin as engineering and design of reactors improves, which would allow for large scale production and workflow optimization as compared to one-off projects that are being executed at present. Regardless of the progression of SMR manufacturing costs relative to gas turbines, GEV is a world leader in both technologies which we view as a tremendous positive.
GEV recently initiated the construction of an engineering and service center for its 300 MW SMR in the Durham Region of Ontario. Additionally, the United States Nuclear Regulatory Commission has formally accepted the Tennessee Valley Authority’s application to construct an SMR at the Clinch River site, a contract which GEV holds. The company expects a number of other customer announcements in the SMR space in the second half of this year.
Wind
GEV offers both onshore and offshore wind turbines, as well as wind farm repower solutions which enable the refurbishment of legacy turbines to allow for significant increases in efficiency and lifespan. Vernova’s wind segment has historically been a drag on results, but ultimately the company builds the product which exhibits the lowest cost of power over the products lifespan against competitors across the globe, meaning if wind power is valid anywhere it is with GE Vernova. In our view, both demand and pricing power will continue to improve in the space as the pinch on global power grows. GEV expects the wind segment to break even as early as the second half of this year.
Hydroelectricity
GE Vernova produces both hydroelectric generators and turbines, currently representing over 25% of the installed capacity across the globe. “Uprating” or refurbishment is a strong trend in the hydroelectricity space, as existing infrastructure which has been present for decades can easily allow for the employment of new and cutting-edge turbine and generator systems to optimize dam operations. In conjunction with this trend GEV’s uprating order book grew by ~61% in Q2 of this year compared to last. Although hydroelectricity is not an area where we see continued growth in new infrastructure in the developed world, it is not reasonably foreseeable that in-place dams be deconstructed, allowing for their maintenance to continue to generate income for GEV as they improve their technologies. Hydroelectricity represents a small portion of GEV’s business, sitting at only ~4% of revenue in 2024.
Corporate Governance and Management Alignment with Shareholders
GEV is led by President and CEO Scott L. Strazik, a home-grown executive with over 20 years of experience at both GE Vernova and General Electric. Strazik holds both a Bachelors and Masters in Economics from Cornell and Columbia respectively. In 2000, Strazik began at what was essentially a co-op program at General Electric, after which point he was consistently promoted, eventually reaching the role of Chief Financial Officer for GE Aviation in 2011. In the summer of 2013, Strazik transitioned to the GE power segment and in November of 2018 he was appointed as the Chief Executive Officer of the segment which is now the standalone GE Vernova.
The remainder of Vernova’s executive team is quite large, which in contrast to most of the companies we analyze we view as a positive. Although GEV is the result of a spinoff, it is still a conglomerate and requires a large amount of human capital to manage operations effectively. In general, the executive team is highly educated, including three JD’s and five MBA’s from top universities across a set of nine individuals. All executives demonstrate a decades long track record of management for large and productive businesses. This includes CFO Kenneth Parks who has served as CFO of four other corporations in the past two decades and Roger Martella, who has over seven years of experience with General Electric and nearly 20 years in General Counsel adjacent roles.
Vernova’s nine-person board has only one non-independent director in Scott Strazik, however he does not serve as Board Chair. The board demonstrates a tremendous level of competence in audit by way of Martina Hund-Mejean and Jesus Malave, who boast experience as the former CFO of MasterCard and current CFO of Boeing respectively. The board also has significant experience in gas solutions and power, with Board Chair Steve Angel currently serving as the Chair at Linde (and previously serving as CEO at Linde and Praxair), Nicholas Akins having served as CEO of American Electric Power, and Paula Rosput Reynolds serving as Chair of the Board of National Grid. Other notable experience includes Matthew Harris, Founding Partner of Global Infrastructure Partners, and Kim K.W. Rucker, JD and former General Counsel at a variety of large corporations. Full board profiles can be found here (link).
GEV employs a quality executive compensation strategy based on a mix of incentives. The majority of compensation comes in the form of equity (see Figure 12 below) which is balanced with base salary and bonus incentives. Annual incentive plans are based on the realization of free cash flow (40% weighting), adjusted EBITDA (40% weighting), and organic revenue growth (20% weighting) targets. PSU’s granted vest contingent upon the realization of trailing three year adjusted EBITDA, free cash flow, and total shareholder return targets. The remainder of equity compensation comes in the form of RSU’s and options with three year rolling vesting, and stock options with a four-year cliff vesting. Overall, the compensation plan drives the realization of concrete financial targets, shareholder returns, and provides the management team with what we view as an appropriate amount of convexity which is balanced by a clawback policy.
Figure 12: GE Vernova Inc. Executive Compensation Summary
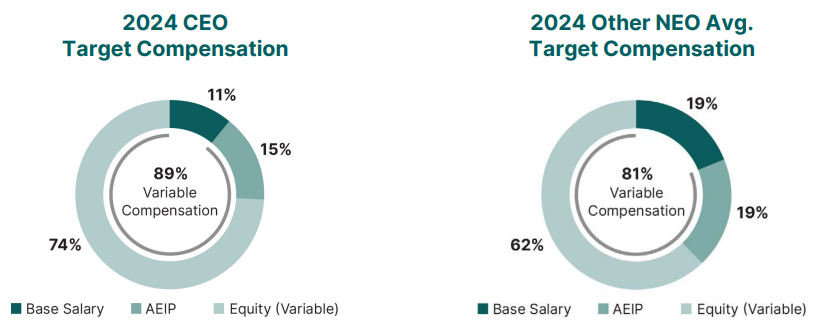
Source: Company Filings
GEV also employs the use of an executive ownership plan. Under the ownership plan, CEO Scott Strazik is required to own a minimum of 6x his annual base salary in equity, with other NEO’s minimums sitting at 3x annual base salary. All NEO’s exceed the requirement by a large margin with the exception of Jessica Uhl, a new add to the executive suite. Directors are also required to own a significant amount of stock at 5x their annual cash retainer.
Equity Valuation
For both Bloom Energy and GE Vernova we will start our valuation analysis looking at multiples and finish with discounted cash flows models and related sensitivity analysis.
Starting with Bloom Energy, the company currently trades at ~53x Enterprise Value/NTM EBITDA, which is slightly above their five-year average of ~42x. Shares have traded as high as just under 110x and as low as ~15x in the same period which demonstrates the volatility which BE shares are subject to. Volatility is a function of a number of factors, the most consequential of which is uncertainty surrounding future performance. At listing (2019) and for years thereafter, Bloom was a company who claimed to be a solution for data center power demand but who had not secured any orders for such. Recent developments with the Oracle, CoreWeave, and AEP contracts derisk their exposure to the trend significantly, and in our view shares should be expected to trade above their five-year average and with less volatility than has been previously present. Figure 13 shows Bloom’s relative valuation over the last five years:
Figure 13: Bloom Energy Enterprise Value / Next 12 Months EBITDA
Source: S&P Capital IQ, Phi Research
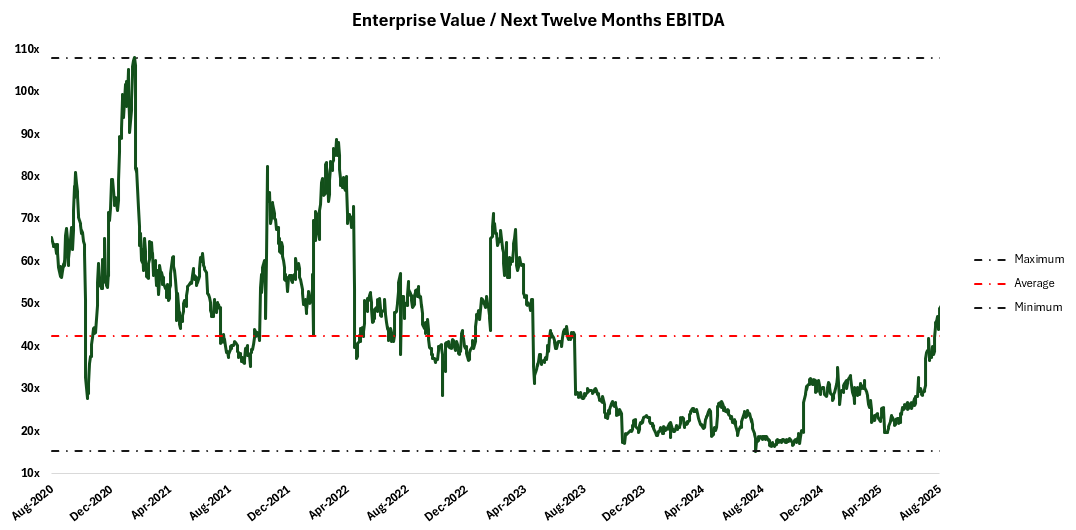
Shares of GEV have only been listed since April of 2024, making a relative valuation against itself a less useful exercise. Since listing, multiple expansion has occurred on the back of GEV realizing massive growth in financial performance and the continuing expectation for more to occur. Figure 14 shows GEV’s relative valuation since listing:
Figure 14: GE Vernova Enterprise Value / Next 12 Months EBITDA
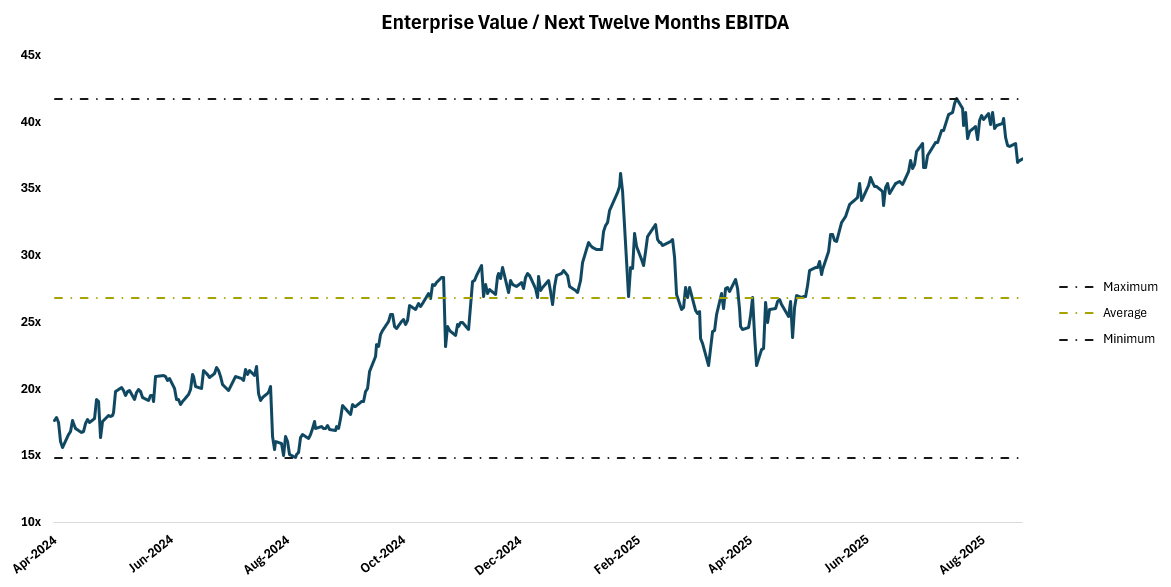
Source: S&P Capital IQ, Phi Research
Unfortunately, we do not believe there is a relevant comparable company to GEV or BE based on the dynamic nature of their businesses at this time. Additionally, for Bloom there is no competitor which offers a technology akin to theirs, and for GEV there is no comp who offers the same bundle of product offerings as they do, let alone in a similar proportion.
Discounted Cash Flows Models
We will start with GE Vernova, for whom we use analyst’s consensus estimates for cash flows as the base for our model. Based on the previously mentioned length of GEV’s backlog, it is fair to assume that there is a fair amount of visibility into results over the next five years, and subsequently in the numbers which management shares with analysts. Figure 15 shows our base case discounted cash flows model on GEV:
Figure 15: GE Vernova Discounted Cash Flows Model
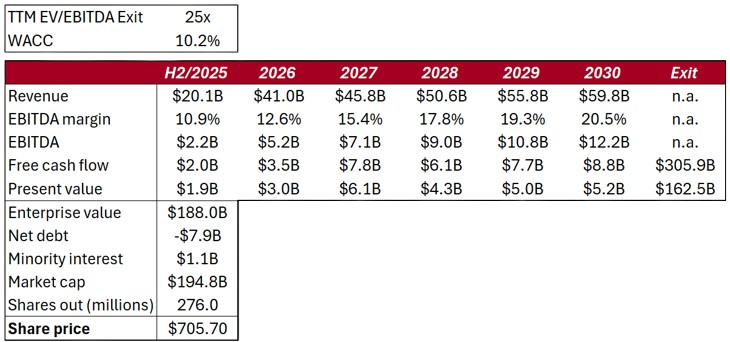
Source: Bloomberg, Company Filings, Phi Research
GE Vernova currently carries zero debt, so we calculate their WACC by way of the CAPM with a monthly beta of 1.56 (data only available since listing), a treasury rate of ~4% and a required return of 8%. Using an EV/TTM EBITDA exit multiple of 25x brings us to a share price of $705.70 in our base case, a ~17% premium to Tuesday’s close of $605.70. In a situation like this, an investors decision on what GEV should be worth rests mostly upon the levels they anticipate equity will trade at upon exit. GEV shares currently trade at ~56x EV/TTM EBITDA, however if there is limited additional growth opportunities in 2030, we believe shares could trade as low as ~10x, similar to a lower growth industrial like Cummins. Figure 16 shows our share price sensitivity analysis on the exit multiple used in our model; the main takeaway is that depending on the power demand picture which is realized five years from now, shares could be overvalued at $605.70 or severely undervalued.
Figure 16: GE Vernova Discounted Cash Flows Sensitivity Analysis

Source: Phi Research
Bloom Energy finds itself in an interesting space in regards to analyst coverage. Much of the street appears to be holding out on recommending the stock for reasons which are unclear. In our view it may be tricky to establish a reasonable price target using one-year multiple valuation, a phenomena which drives more hold ratings in other underappreciated equities like Telesat. A number of estimates on the street also do not account for any of the capacity expansion efforts which BE is currently undergoing, and a quick listen to the Q2 conference call does a good job in displaying the analysts understanding of such activities (the same questions regarding the expansion were asked multiple times, management declined to answer in respect for the time of those who were actually listening). For these reasons, we have compiled a group of estimates which account for the buildout of additional capacity and used them as a base for our model. Bloom does not exhibit the same degree of certainty in cash flows as GEV due to differences in backlog, but we believe this difference is reflected in Bloom’s cost of equity being calculated at 17.05% based on the CAPM. It could easily be argued that this cost of capital is overly punitive and is a failure of the beta system; we will discuss this in our sensitivity analysis. Figure 17 shows our discounted cash flows model for Bloom Energy, using a calculated WACC of 15.8% and an EV/EBITDA exit multiple of 25x:
Figure 17: Bloom Energy Discounted Cash Flows Model
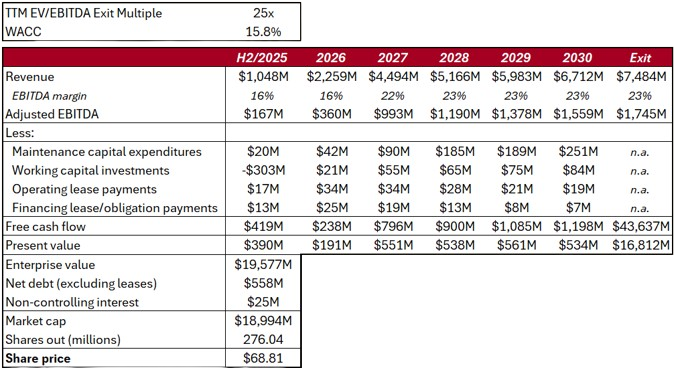
Source: Bloomberg, Company Filings, Phi Research
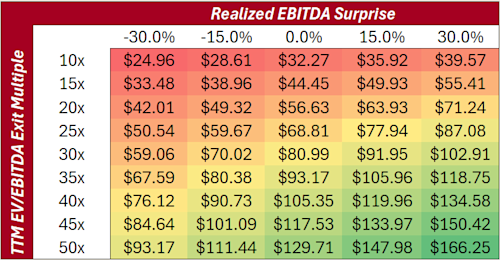
Our base case discounted cash flows model brings us to a share price of $68.81, a 25% premium to Tuesday’s close of $55.00. In our sensitivity analysis, the first two elements we believe should be tested are the exit multiple used (which we believe a similar range of multiples is reasonable as is for GEV), and a surprise factor on our EBITDA estimate to account for the lower visibility of financial performance in Bloom as compared to GEV. For reference in the figure below, an EBITDA surprise factor of 30% would imply that the EBITDA which BE realizes over the period of our model is 30% higher than our base case model forecasts. Figure 18 shows our sensitivity analysis on Bloom:
Figure 18: Bloom Energy Discounted Cash Flows Sensitivity Analysis
Source: Phi Research
As we previously stated, we don’t believe that Bloom’s monthly beta of 3.29 is a fair representation of the risk associated with the asset. A cost of equity of ~17% is not reasonable for any company, outside of speculative pre-revenue equities or the oil and gas industry. The oil and gas industry is a perfect example of the failure of the beta system. Oil and gas equities will often push towards a beta of either zero or a high number in excess of two due to their correlation to unique factors. This occurs in equities which are in the same stage in the development of their asset base, and in companies who hold very similar assets, meaning their cost of capital should be very similar. As a result, the industry has adopted a standard cost of capital of 10% across all equities. Another prime example of the failure of the beta system is the difference in beta between MDA Space and both Telesat and AST Space Mobile. MDA Space exhibits a beta which is near zero, compared to Telesat and AST Space Mobile which exude beta levels of 1.97 and 2.42 respectively. Although there are differences between the equities, they all hold exposure to the same broad scale risks and should thusly display similar beta levels.
In our opinion, Bloom is another failure of the beta system. Volatility is not akin to risk, and Bloom’s volatility is not a function of changes in underlying fundamentals (true risk), but rather of the speculation surrounding such fundamentals. Equities with similar macroeconomic trend exposure tend to display beta’s in the range of 1.5-2.0 (think names like NVDA, SMCI, ORCL, GEV). Another proof point of BE’s overstated cost of equity is the cheap debt financing the company is able to secure. Bloom has tranches of green debt with rates as low as 2.5%, with non-green term debt currently sitting at a cost of 4.6%. If debt is priced correctly, generally a company’s cost of equity is equal to this rate plus an additional ~150-300 basis points, which points towards a cost of equity for Bloom in the range of 6-8%.
As the company executes on current initiatives and becomes more widely known, it is reasonable to assume that Bloom’s technical cost of equity falls to levels similar to peers in the space. Both because of this, and for the other reasons explained above, we believe that a cost of capital in the range of 12% is much more reasonable for BE than the CAPM based rate. In Figure 19 we provide sensitivity analysis on our BE discounted cash flows model under the assumption that Bloom’s cost of equity is 12%:
Figure 19: Bloom Energy Discounted Cash Flows Sensitivity Analysis (12% Cost of Equity)
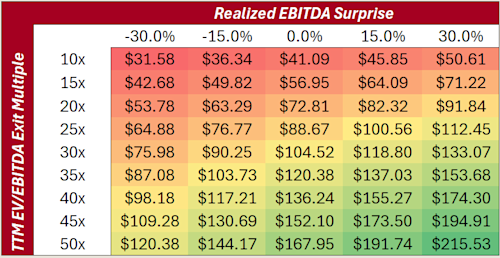
Source: Phi Research
Under our assumption of a 12% cost of equity, our base case scenario now brings us to a value of $88.67 per share, a ~61% premium to Tuesday’s close of $55.00.
In general, both GEV and BE are “expensive” equities, and it is easy for investors to be dissuaded by their valuations on a multiples basis, or by the value of the underlying if growth is not realized in the short and medium term. In scenarios like this it is very difficult to pin down an exact price that seems reasonable for entrance and exit; the reality is that if power demand is a persistent and long term trend none of this is a concern. Five years from now, the power demand pinch could easily be worse than it is today. In our view, it is extremely unlikely that this theme plays out in such a short time frame, meaning that in our cash flows models sensitivity analysis, we see the upper end of our analyzed exit multiples as the most likely outcome. Under this assumption, both GEV and BE are very attractively priced at current levels.
Summary and Investment Decision
Ultimately what our thesis boils down to from an investment decision perspective is whether or not you believe power demand growth is a five, ten, fifty, or hundred year trend. The advancement of AI infrastructure is inevitable in our view, and whether it be by way of increasing scale, scope, or both, the pursuit of a product which captures an addressable market of this size will be both fierce and long term. A continuing move towards isolationist policy and the reindustrialization of the United States provides an additional backstop for demand growth, a trend which is supported by Republicans and Democrats alike. In our view, there is nothing which points towards the power demand trend slowing down in the long term and as a result, we rate both Bloom Energy Corporation and GE Vernova Inc. as a Strong Buy.