Exiting Position: GE Vernova Inc. (NYSE: GEV)
Published on 2026-07-16
This morning we exited our position in GE Vernova Inc., selling our shares at a realized price of US$1,035.00. Our decision is driven by a mix of factors, namely the equity’s expanding valuation, extreme expectations for financial performance from the market in the short term, and a general decision to move away from high-beta plays in the short term. Our position in GEV generated a 74% return in Canadian dollar terms, or 92% on an annualized basis.

Our original thesis on GEV was published in September of 2025 (link). At the time, we posited GEV (as well as Bloom Energy) as a prime beneficiary of spending in AI infrastructure and American electrification and reindustrialization, with both securities appearing to be high quality in all facets and priced at attractive levels. Three main factors have driven our change of heart on GEV:
Valuation
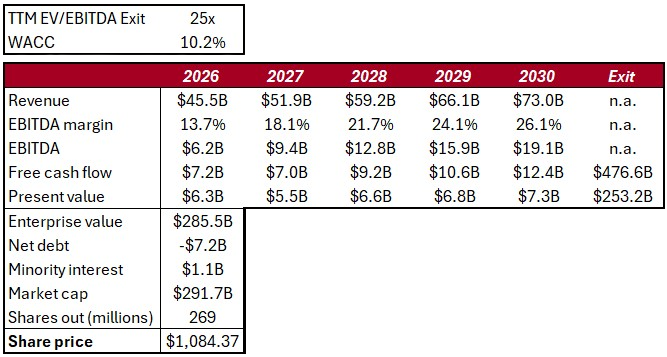
Our goal with Phi Research is to hold positions in securities which we believe are fundamentally mispriced. GEV trades nearly twice as high as when we opened our position, and although consensus expectations for future financials have grown in the same time frame, there is a limit to the growth of such expectations. Figure 1 shows our updated discounted cash flows model which is reflective of analyst’s consensus values. Note that the exit multiple used implies a ~2.6% free cash flow yield at exit.
Figure 1: Updated Discounted Cash Flows Model
Source: S&P Capital IQ, Phi Research
At present, GEV shares have essentially priced in consensus estimates and a terminal growth rate in excess of 5%. Owning GEV at present is not a bet that financial estimates will be achieved, it is a bet that they will be raised.
As compared to last September, EBITDA and free cash flow expectations have risen ~50%, largely attributable to increased margin expectations (26.1% in 2030e). GEV is a leader in the natural gas turbines space, however quality alternatives do exist and place a limit on the pricing power which the firm can exercise in the long term. Margins exceeding 25% is already very high in the industrials space - we do not believe significant upside to these estimates exists at this point, and thus are not willing to bet on it.
From a capacity growth perspective, demand for power is growing at ~5% per annum as per long and short term estimates. Without growing pricing power, GEV’s exit multiple is essentially baking in mid to high single digit growth in unit demand forever, something which may be reasonable, but once again does not appear to have significant upside from our perspective.
In short, shares are currently pricing in consensus financial expectations, and expectations are now very high and do not appear to have material upside. As is such, we do not believe that GEV shares are attractively valued at current levels and will not likely produce returns well above their cost of capital going forward.
Lofty Market Expectations
GEV is set to report its Q2/2026 results next Wednesday, July 22nd, before the opening bell. The stock has historically performed well in conjunction with its quarterly releases as it frequently delivers ‘beat-and-raise’ prints. We believe the repetition of this trend is increasing unlikely as the market’s expectations grow for the equity. As discussed above, we see much lower upside to financial estimates being raised than has existed historically. When looking at precedents in the AI and power infrastructure space, we have often seen that even in the case of strong quarterly prints, a ‘beat-and-raise’ scenario was already priced in from an event-driven perspective after a company has developed a track record of such outstanding execution. One such precedent is ABB, a Swedish comparable to GEV who reported this morning. ABB recorded a record print in essentially every metric while also raising financial expectations. In spite of this, the stock traded down nearly 6% on the day. Of note, only 2% Y/Y of topline growth from ABB was attributable to price increases, testament to the exhaustion of pricing power gains we mentioned above.
GE Aerospace is another interesting peer in regards to strong quarters and weak equity reactions. Although not a power comp to GEV, GE Aerospace has seen a tremendous amount of positive momentum and continuing blowout quarters in recent years. The company reported another record quarter this morning and is also down over 6% at current intraday levels.
Although these dynamics have not driven our decision to sell alone as we invest with a long time horizon, they have pushed us not to wait for the Q2 release prior to exiting our position.
High-Beta Downside
2026 and 2027 are likely to produce unprecedented levels of security issuances, coming in the form of initial offerings from companies like SpaceX, OpenAI, Anthropic, and DataBricks, large secondary offerings from companies like Alphabet and SK Hynix, and large, persistent debt sales from Amazon, Meta, Oracle, Nvidia, and more. From a broad-market perspective, these assets are in many ways substitutes for each other, with GEV shares included in the basket of high-beta equities at present. There is a limited amount of demand for high risk assets, and the continuing issuance of said assets will inevitably inflict downward pressure on the group as a whole as an additional trillion dollars + comes to market. On a 12-18 month timeframe, we can see a market which increasingly pulls money from GEV, even if only to fund the purchase of similar securities being sold at discounted offering prices.
Although this perspective does not invalidate our original thesis on GEV, when weighing this information with our perspective on the equity’s long term upside in the context of its current valuation it is difficult for us to be excited about holding a position in the security, thus we exit at current levels.
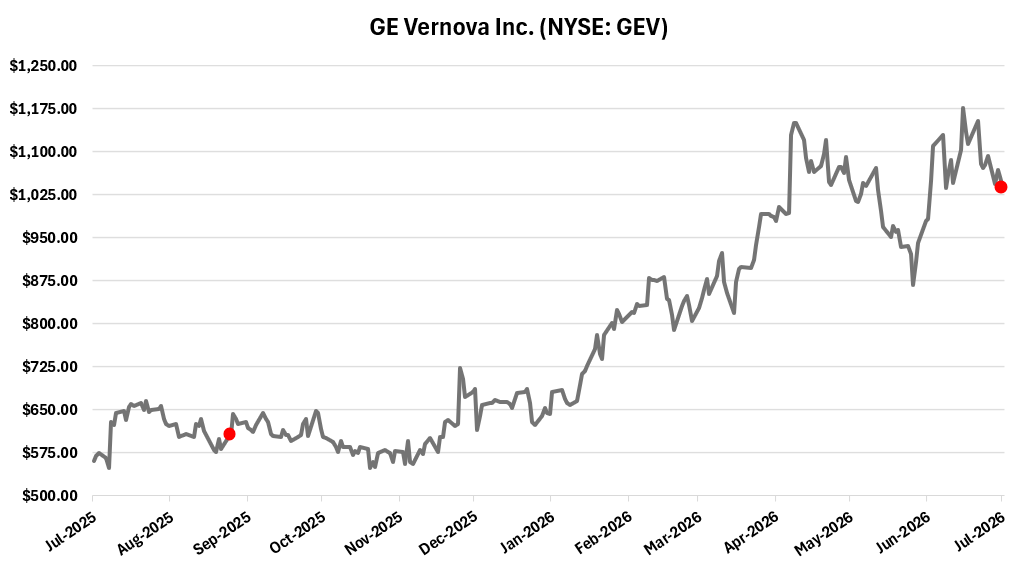
Figure 2 below shows the evolution of GEV’s price over the timeframe of our position. With the constant reinvestment of dividends, our position represents a 74% total return in CAD terms or 71% in USD terms. On an annualized basis, these returns convert to 92% and 88% respectively. In the below figure, the red dots represent our position entrance and exit dates.
Figure 2: Holding Period Price Evolution
Source: S&P Capital IQ, Phi Research